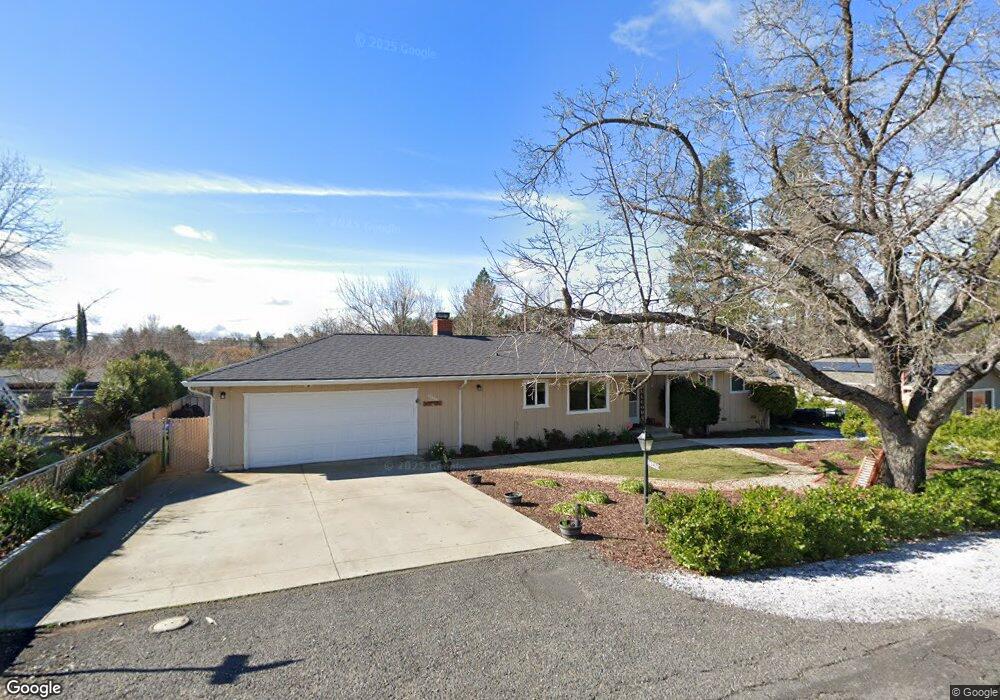
20420 W Walnut Dr Sonora, CA 95370
Estimated Value: $390,454 - $446,000
3
Beds
2
Baths
1,438
Sq Ft
$288/Sq Ft
Est. Value
About This Home
This home is located at 20420 W Walnut Dr, Sonora, CA 95370 and is currently estimated at $413,864, approximately $287 per square foot. 20420 W Walnut Dr is a home located in Tuolumne County with nearby schools including Columbia Elementary School, Sonora High School, and Theodore Bird High School.
Ownership History
Date
Name
Owned For
Owner Type
Purchase Details
Closed on
Oct 29, 2018
Sold by
Pedro Craig L and Pedro Ruth E
Bought by
Butterfield Jonathon and Butterfield Christa
Current Estimated Value
Home Financials for this Owner
Home Financials are based on the most recent Mortgage that was taken out on this home.
Original Mortgage
$315,425
Outstanding Balance
$276,213
Interest Rate
4.6%
Mortgage Type
FHA
Estimated Equity
$137,651
Purchase Details
Closed on
Oct 5, 2018
Sold by
Pedro Craig L and Pedro Ruth E
Bought by
Pedro Craig L and Pedro Ruth E
Home Financials for this Owner
Home Financials are based on the most recent Mortgage that was taken out on this home.
Original Mortgage
$315,425
Outstanding Balance
$276,213
Interest Rate
4.6%
Mortgage Type
FHA
Estimated Equity
$137,651
Purchase Details
Closed on
Dec 22, 2010
Sold by
Pedro Craig L and Pedro Ruth E
Bought by
Pedro Craig L and Pedro Ruth E
Create a Home Valuation Report for This Property
The Home Valuation Report is an in-depth analysis detailing your home's value as well as a comparison with similar homes in the area
Home Values in the Area
Average Home Value in this Area
Purchase History
| Date | Buyer | Sale Price | Title Company |
|---|---|---|---|
| Butterfield Jonathon | $330,000 | Yosemite Title Co | |
| Pedro Craig L | -- | None Available | |
| Pedro Craig L | -- | None Available |
Source: Public Records
Mortgage History
| Date | Status | Borrower | Loan Amount |
|---|---|---|---|
| Open | Butterfield Jonathon | $315,425 |
Source: Public Records
Tax History
| Year | Tax Paid | Tax Assessment Tax Assessment Total Assessment is a certain percentage of the fair market value that is determined by local assessors to be the total taxable value of land and additions on the property. | Land | Improvement |
|---|---|---|---|---|
| 2025 | $1,470 | $146,952 | $40,601 | $106,351 |
| 2024 | $1,470 | $144,071 | $39,805 | $104,266 |
| 2023 | $1,446 | $141,247 | $39,025 | $102,222 |
| 2022 | $1,418 | $138,478 | $38,260 | $100,218 |
| 2021 | $1,386 | $135,763 | $37,510 | $98,253 |
| 2020 | $1,368 | $134,372 | $37,126 | $97,246 |
| 2019 | $1,321 | $131,739 | $36,399 | $95,340 |
| 2018 | $1,334 | $129,157 | $35,686 | $93,471 |
| 2017 | $1,273 | $126,626 | $34,987 | $91,639 |
| 2016 | $1,247 | $124,144 | $34,301 | $89,843 |
| 2015 | $1,227 | $122,280 | $33,786 | $88,494 |
| 2014 | $1,153 | $115,964 | $33,125 | $82,839 |
Source: Public Records
Map
Nearby Homes
- 20445 W Walnut Dr
- 20381 Nashua Rd
- 20364 Nashua Rd
- 20475 Eureka Dr
- 20369 E Walnut Dr
- 20580 Bay Meadows Dr
- 10879 Martin Terrace Ct
- 471 Arbona Cir N
- 19849 Villa Dr
- 745 Arbona Cir N
- 20955 Shaws Flat Rd
- 830 Shaws Flat Rd
- 38 Saratoga Rd
- 20000 Jamestown Rd
- 19100 Jamestown Rd
- 18900 Jamestown Rd
- 15 Corte Del Encino
- 247 Mccormick Dr
- 6 S Forrest
- 130 Cottage Ct
- 20410 W Walnut Dr
- 20430 W Walnut Dr
- 20405 Nashua Rd
- 20401 Nashua Rd
- 20427 Nashua Rd
- 20425 W Walnut Dr
- 20396 W Walnut Dr
- 11065 Fallon Dr
- 20440 W Walnut Dr
- 20395 Nashua Rd
- 20441 Nashua Rd
- 20408 Nashua Rd
- 20435 W Walnut Dr
- 20395 W Walnut Dr
- 20372 W Walnut Dr
- 11075 Fallon Dr
- 11080 Fallon Dr
- 10996 Derby Dr
- 20450 W Walnut Dr
- 20389 Nashua Rd