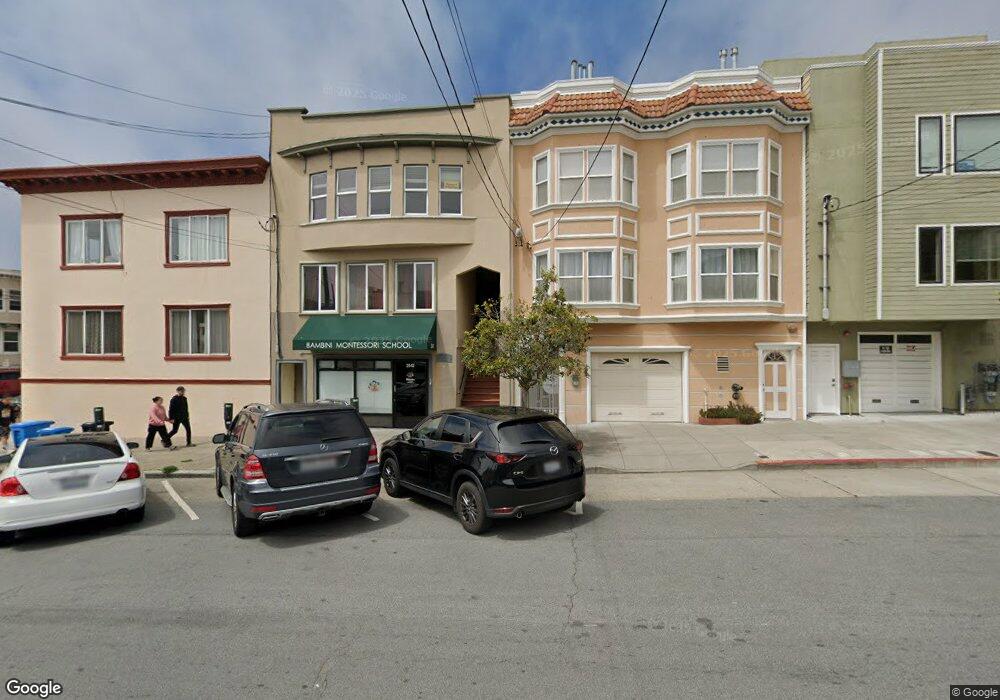
2044 Clement St Unit 2046 San Francisco, CA 94121
Central Richmond NeighborhoodEstimated Value: $1,991,000 - $2,545,228
--
Bed
3
Baths
3,552
Sq Ft
$606/Sq Ft
Est. Value
About This Home
This home is located at 2044 Clement St Unit 2046, San Francisco, CA 94121 and is currently estimated at $2,153,807, approximately $606 per square foot. 2044 Clement St Unit 2046 is a home located in San Francisco County with nearby schools including Alamo Elementary School, Presidio Middle School, and The Bay School Of San Francisco.
Ownership History
Date
Name
Owned For
Owner Type
Purchase Details
Closed on
Jul 19, 2025
Sold by
Dang Quoc Cuong
Bought by
Quoc Cuong Dang Living Trust and Dang
Current Estimated Value
Purchase Details
Closed on
Aug 14, 2012
Sold by
Trio Investments Llc
Bought by
Dang Quoc Cuong
Purchase Details
Closed on
Feb 28, 2006
Sold by
Jang Blossom
Bought by
Trio Investments Llc
Purchase Details
Closed on
Mar 2, 2005
Sold by
Nakano Joann
Bought by
Jang Blossom Lum
Home Financials for this Owner
Home Financials are based on the most recent Mortgage that was taken out on this home.
Original Mortgage
$700,000
Interest Rate
5.65%
Mortgage Type
Commercial
Purchase Details
Closed on
Jun 16, 2003
Sold by
Nakano Irene
Bought by
Nakano Joana
Purchase Details
Closed on
Apr 25, 2003
Sold by
Nakano Joann
Bought by
Nakano Irene C
Create a Home Valuation Report for This Property
The Home Valuation Report is an in-depth analysis detailing your home's value as well as a comparison with similar homes in the area
Home Values in the Area
Average Home Value in this Area
Purchase History
| Date | Buyer | Sale Price | Title Company |
|---|---|---|---|
| Quoc Cuong Dang Living Trust | -- | None Listed On Document | |
| Dang Quoc Cuong | $1,420,500 | North American Title Company | |
| Trio Investments Llc | $545,000 | None Available | |
| Jang Blossom Lum | $1,080,500 | Old Republic Title Company | |
| Nakano Joana | -- | -- | |
| Nakano Irene C | -- | -- |
Source: Public Records
Mortgage History
| Date | Status | Borrower | Loan Amount |
|---|---|---|---|
| Previous Owner | Jang Blossom Lum | $700,000 |
Source: Public Records
Tax History Compared to Growth
Tax History
| Year | Tax Paid | Tax Assessment Tax Assessment Total Assessment is a certain percentage of the fair market value that is determined by local assessors to be the total taxable value of land and additions on the property. | Land | Improvement |
|---|---|---|---|---|
| 2025 | $21,087 | $1,748,724 | $1,224,110 | $524,614 |
| 2024 | $21,087 | $1,714,436 | $1,200,108 | $514,328 |
| 2023 | $20,681 | $1,680,821 | $1,176,577 | $504,244 |
| 2022 | $20,277 | $1,647,864 | $1,153,507 | $494,357 |
| 2021 | $19,921 | $1,615,554 | $1,130,890 | $484,664 |
| 2020 | $20,107 | $1,598,990 | $1,119,295 | $479,695 |
| 2019 | $19,424 | $1,567,639 | $1,097,349 | $470,290 |
| 2018 | $18,767 | $1,536,902 | $1,075,833 | $461,069 |
| 2017 | $18,250 | $1,506,768 | $1,054,739 | $452,029 |
| 2016 | $17,955 | $1,477,224 | $1,034,058 | $443,166 |
| 2015 | $17,731 | $1,455,036 | $1,018,526 | $436,510 |
| 2014 | $17,266 | $1,426,535 | $998,575 | $427,960 |
Source: Public Records
Map
Nearby Homes
- 2205 Clement St
- 1827 Clement St
- 316 25th Ave
- 375 25th Ave Unit 401
- 172 18th Ave
- 252 26th Ave
- 6423 California St
- 6424 California St
- 1638 Lake St
- 239 26th Ave Unit 302
- 2526 Lake St
- 576 27th Ave
- 2725 Clement St
- 2133 Balboa St
- 428 15th Ave
- 1608 Balboa St
- 28 15th Ave
- 1324 Lake St
- 516 15th Ave Unit 518
- 518 15th Ave
- 2042 Clement St
- 2038 Clement St Unit 1
- 2038 Clement St Unit 3
- 2038 Clement St Unit 2
- 2034 Clement St
- 278 22nd Ave
- 274 22nd Ave
- 2020 Clement St
- 2020 Clement St Unit 1
- 2020 Clement St Unit 3
- 2020 Clement St Unit 2
- 270 22nd Ave Unit 272
- 2016 Clement St
- 266 22nd Ave Unit 268
- 2100 Clement St
- 277 21st Ave
- 273 21st Ave
- 271 22nd Ave Unit 273
- 306 22nd Ave
- 295 21st Ave