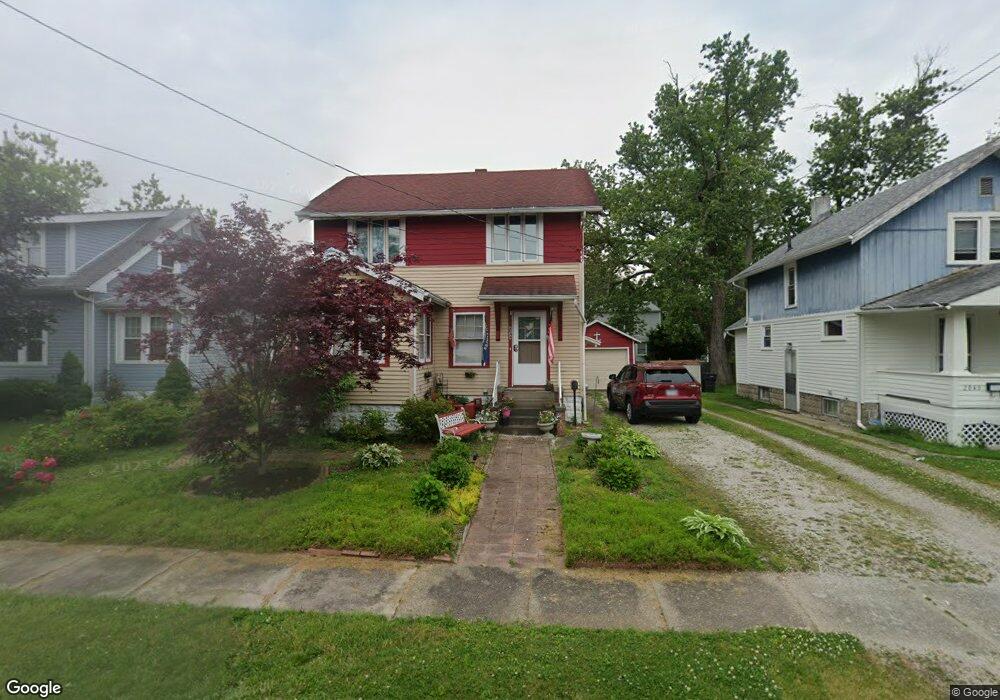
2044 E 39th St Ashtabula, OH 44004
Estimated Value: $117,441 - $158,000
3
Beds
1
Bath
1,274
Sq Ft
$112/Sq Ft
Est. Value
About This Home
This home is located at 2044 E 39th St, Ashtabula, OH 44004 and is currently estimated at $142,610, approximately $111 per square foot. 2044 E 39th St is a home located in Ashtabula County with nearby schools including Ridgeview Elementary School, Kingsville Elementary School, and Wallace H. Braden Junior High School.
Ownership History
Date
Name
Owned For
Owner Type
Purchase Details
Closed on
May 31, 2012
Sold by
Jackson John A
Bought by
Akin Selma C Van
Current Estimated Value
Home Financials for this Owner
Home Financials are based on the most recent Mortgage that was taken out on this home.
Original Mortgage
$52,551
Outstanding Balance
$36,573
Interest Rate
3.92%
Mortgage Type
New Conventional
Estimated Equity
$106,037
Purchase Details
Closed on
Dec 19, 2002
Sold by
Benedict Robert
Bought by
Jackson John A
Create a Home Valuation Report for This Property
The Home Valuation Report is an in-depth analysis detailing your home's value as well as a comparison with similar homes in the area
Home Values in the Area
Average Home Value in this Area
Purchase History
| Date | Buyer | Sale Price | Title Company |
|---|---|---|---|
| Akin Selma C Van | $51,500 | Chicago Title | |
| Jackson John A | $55,900 | -- |
Source: Public Records
Mortgage History
| Date | Status | Borrower | Loan Amount |
|---|---|---|---|
| Open | Akin Selma C Van | $52,551 |
Source: Public Records
Tax History
| Year | Tax Paid | Tax Assessment Tax Assessment Total Assessment is a certain percentage of the fair market value that is determined by local assessors to be the total taxable value of land and additions on the property. | Land | Improvement |
|---|---|---|---|---|
| 2024 | $2,506 | $28,360 | $4,660 | $23,700 |
| 2023 | $1,310 | $28,360 | $4,660 | $23,700 |
| 2022 | $1,100 | $20,520 | $3,610 | $16,910 |
| 2021 | $1,110 | $20,520 | $3,610 | $16,910 |
| 2020 | $1,110 | $20,520 | $3,610 | $16,910 |
| 2019 | $960 | $16,460 | $2,420 | $14,040 |
| 2018 | $929 | $16,460 | $2,420 | $14,040 |
| 2017 | $915 | $16,460 | $2,420 | $14,040 |
| 2016 | $967 | $17,720 | $2,630 | $15,090 |
| 2015 | $966 | $17,720 | $2,630 | $15,090 |
| 2014 | $942 | $17,720 | $2,630 | $15,090 |
| 2013 | $848 | $16,350 | $3,120 | $13,230 |
Source: Public Records
Map
Nearby Homes
- 2124 E 40th St
- 4016 State Rd
- 4211 Birchwood Ave
- 2130 E 44th St
- 4422 Rodgers Rd
- 4320 Birchwood Ave
- 4422 State Rd
- 1629 E 47th St
- 3603 Silvieus Dr
- 3024 Latimer Ave
- 3129 Lincoln Dr
- 4211 Park Ave
- 3038 Eureka Rd
- 3003 Blair Ave
- 3001 Blair Ave
- 1930 E 52nd St
- 3033 Avon Blvd
- 2930 S Ridge Rd E
- 3835 Lake Ave
- 183 1626 E 51st St
Your Personal Tour Guide
Ask me questions while you tour the home.