Estimated Value: $233,000 - $270,490
3
Beds
2
Baths
1,011
Sq Ft
$248/Sq Ft
Est. Value
About This Home
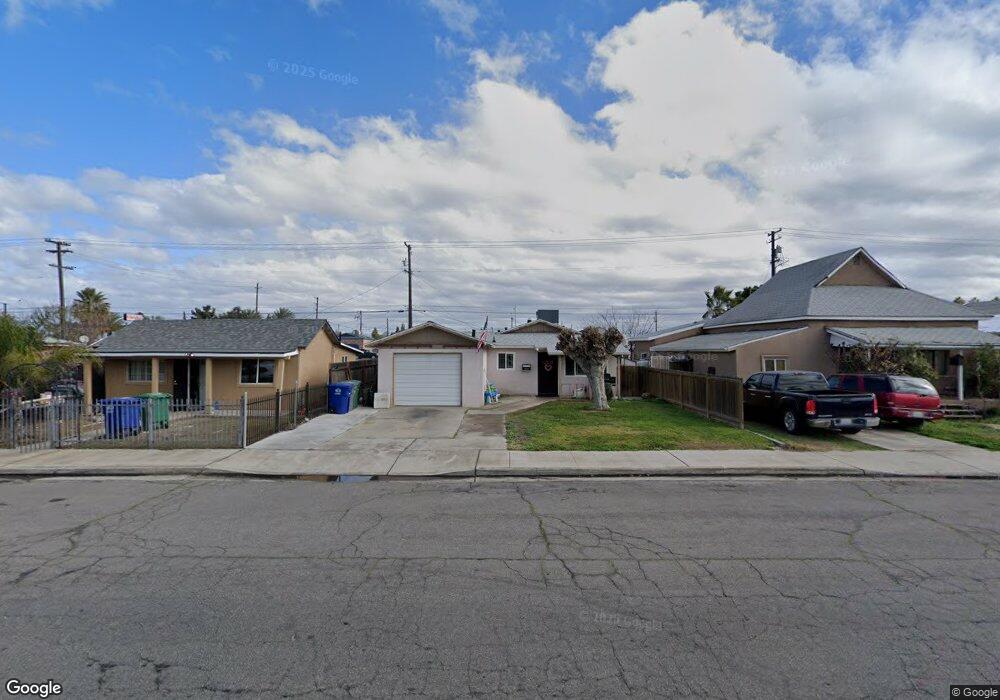
This home is located at 2044 Sylvia St, Selma, CA 93662 and is currently estimated at $251,163, approximately $248 per square foot. 2044 Sylvia St is a home located in Fresno County with nearby schools including James Garfield Elementary School, Abraham Lincoln Middle School, and Selma High School.
Ownership History
Date
Name
Owned For
Owner Type
Purchase Details
Closed on
Sep 21, 2023
Sold by
Rea Barbara M
Bought by
Sustaita Joseph Daniel
Current Estimated Value
Purchase Details
Closed on
Nov 19, 2001
Sold by
Rea Santos F
Bought by
Rea Santos F and Rea Barbara M
Home Financials for this Owner
Home Financials are based on the most recent Mortgage that was taken out on this home.
Original Mortgage
$107,582
Interest Rate
6.57%
Purchase Details
Closed on
Jun 4, 1998
Sold by
Rea Barbara M
Bought by
Rea Santos F
Home Financials for this Owner
Home Financials are based on the most recent Mortgage that was taken out on this home.
Original Mortgage
$32,000
Interest Rate
7.17%
Mortgage Type
Stand Alone Second
Create a Home Valuation Report for This Property
The Home Valuation Report is an in-depth analysis detailing your home's value as well as a comparison with similar homes in the area
Home Values in the Area
Average Home Value in this Area
Purchase History
| Date | Buyer | Sale Price | Title Company |
|---|---|---|---|
| Sustaita Joseph Daniel | -- | None Listed On Document | |
| Rea Santos F | -- | Fidelity National Title Co | |
| Rea Santos F | -- | Fidelity National Title Co |
Source: Public Records
Mortgage History
| Date | Status | Borrower | Loan Amount |
|---|---|---|---|
| Previous Owner | Rea Santos F | $107,582 | |
| Previous Owner | Rea Santos F | $32,000 | |
| Closed | Rea Santos F | $16,000 |
Source: Public Records
Tax History
| Year | Tax Paid | Tax Assessment Tax Assessment Total Assessment is a certain percentage of the fair market value that is determined by local assessors to be the total taxable value of land and additions on the property. | Land | Improvement |
|---|---|---|---|---|
| 2025 | $3,339 | $204,000 | $40,800 | $163,200 |
| 2023 | $1,111 | $48,273 | $5,967 | $42,306 |
| 2022 | $1,491 | $47,327 | $5,850 | $41,477 |
| 2021 | $1,449 | $46,400 | $5,736 | $40,664 |
| 2020 | $1,421 | $45,926 | $5,678 | $40,248 |
| 2019 | $1,371 | $45,026 | $5,567 | $39,459 |
| 2018 | $1,335 | $44,144 | $5,458 | $38,686 |
| 2017 | $1,264 | $43,279 | $5,351 | $37,928 |
| 2016 | $1,155 | $42,432 | $5,247 | $37,185 |
| 2015 | $1,163 | $41,796 | $5,169 | $36,627 |
| 2014 | $1,119 | $40,978 | $5,068 | $35,910 |
Source: Public Records
Map
Nearby Homes
- 2116 Sylvia St
- 2772 Valley View St
- 2022 Bauder St
- 2226 Arrants St
- 0 Rose Ave
- 2126 Tulare St
- 2629 Mccall Ave
- 2510 Whitson St
- 2561 Stillman St Unit 111
- 2753 Thompson Ave
- 2766 Lee St
- 2002 Merced St
- 12623 S Mccall Ave
- 2221 Floral Ave
- 1517 Stillman St
- 2469 Shaft St
- 1361 Almond St
- 2482 Country Club Ln
- 2405 Country Club Ln
- 1233 Redwood Ln
Your Personal Tour Guide
Ask me questions while you tour the home.