Estimated Value: $239,677 - $255,000
3
Beds
1
Bath
1,045
Sq Ft
$240/Sq Ft
Est. Value
About This Home
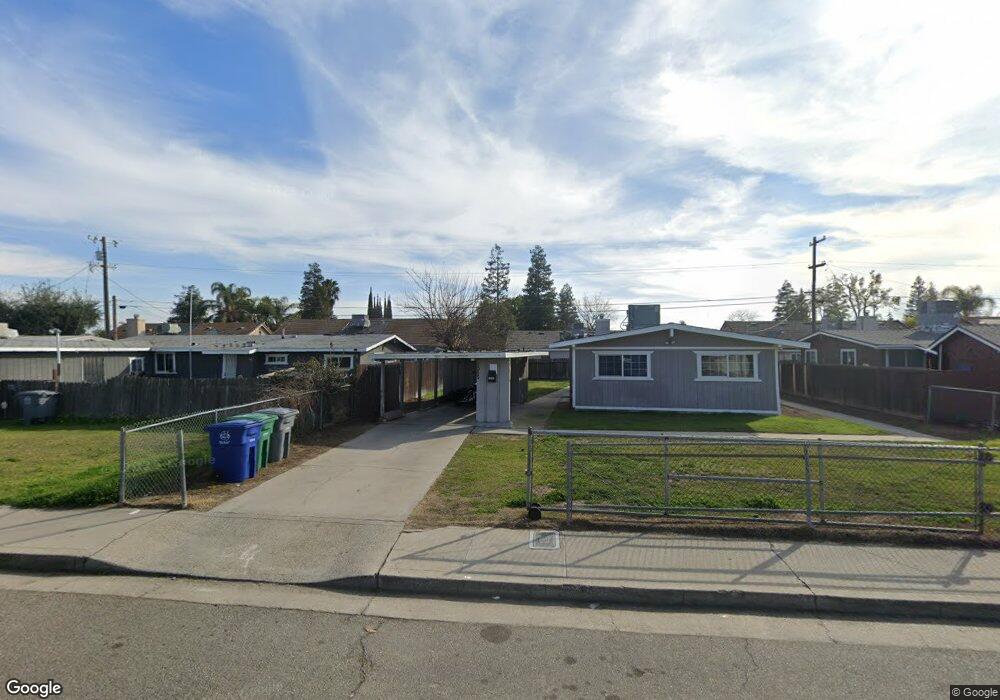
This home is located at 2045 Aspen St, Selma, CA 93662 and is currently estimated at $250,419, approximately $239 per square foot. 2045 Aspen St is a home located in Fresno County with nearby schools including Theodore Roosevelt Elementary School, Abraham Lincoln Middle School, and Selma High School.
Ownership History
Date
Name
Owned For
Owner Type
Purchase Details
Closed on
Jun 27, 2012
Sold by
Carrillo Robert P and Carrillo Julia E
Bought by
Pestorich Holdings Llc
Current Estimated Value
Purchase Details
Closed on
Sep 26, 2006
Sold by
Clark William J and Clark Lawanda
Bought by
Carrillo Robert P and Carrillo Julia E
Home Financials for this Owner
Home Financials are based on the most recent Mortgage that was taken out on this home.
Original Mortgage
$33,600
Interest Rate
6.28%
Mortgage Type
Stand Alone Second
Create a Home Valuation Report for This Property
The Home Valuation Report is an in-depth analysis detailing your home's value as well as a comparison with similar homes in the area
Home Values in the Area
Average Home Value in this Area
Purchase History
| Date | Buyer | Sale Price | Title Company |
|---|---|---|---|
| Pestorich Holdings Llc | $52,500 | None Available | |
| Carrillo Robert P | $168,000 | Financial Title Company |
Source: Public Records
Mortgage History
| Date | Status | Borrower | Loan Amount |
|---|---|---|---|
| Previous Owner | Carrillo Robert P | $33,600 | |
| Previous Owner | Carrillo Robert P | $134,400 |
Source: Public Records
Tax History Compared to Growth
Tax History
| Year | Tax Paid | Tax Assessment Tax Assessment Total Assessment is a certain percentage of the fair market value that is determined by local assessors to be the total taxable value of land and additions on the property. | Land | Improvement |
|---|---|---|---|---|
| 2025 | $1,716 | $64,514 | $36,938 | $27,576 |
| 2023 | $1,716 | $62,010 | $35,504 | $26,506 |
| 2022 | $1,645 | $60,795 | $34,808 | $25,987 |
| 2021 | $1,600 | $59,604 | $34,126 | $25,478 |
| 2020 | $1,571 | $58,994 | $33,777 | $25,217 |
| 2019 | $1,519 | $57,838 | $33,115 | $24,723 |
| 2018 | $1,480 | $56,705 | $32,466 | $24,239 |
| 2017 | $1,407 | $55,594 | $31,830 | $23,764 |
| 2016 | $1,283 | $54,505 | $31,206 | $23,299 |
| 2015 | $1,295 | $53,688 | $30,738 | $22,950 |
| 2014 | $1,249 | $52,637 | $30,136 | $22,501 |
Source: Public Records
Map
Nearby Homes