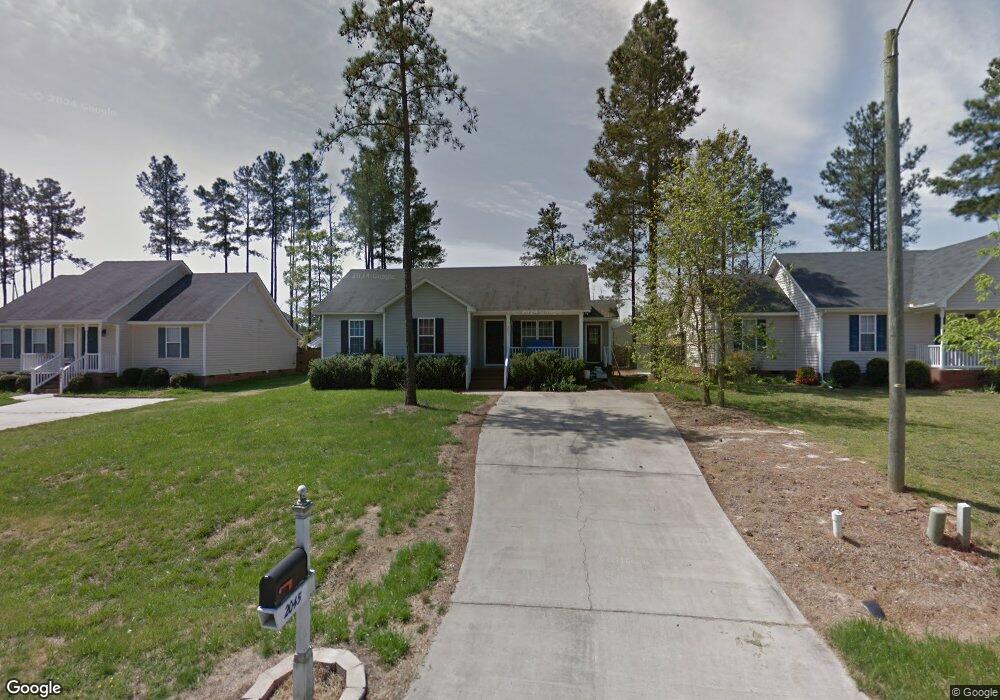
2045 Ballston Place Knightdale, NC 27545
Shotwell NeighborhoodEstimated Value: $259,000 - $281,000
3
Beds
2
Baths
1,138
Sq Ft
$240/Sq Ft
Est. Value
About This Home
This home is located at 2045 Ballston Place, Knightdale, NC 27545 and is currently estimated at $272,864, approximately $239 per square foot. 2045 Ballston Place is a home located in Wake County with nearby schools including Knightdale Elementary School, Neuse River Middle School, and Knightdale High.
Ownership History
Date
Name
Owned For
Owner Type
Purchase Details
Closed on
Apr 27, 2006
Sold by
Homecomings Financial Network Inc
Bought by
Rodriguez Carlos Y
Current Estimated Value
Home Financials for this Owner
Home Financials are based on the most recent Mortgage that was taken out on this home.
Original Mortgage
$82,000
Outstanding Balance
$47,246
Interest Rate
6.31%
Mortgage Type
Purchase Money Mortgage
Estimated Equity
$225,618
Purchase Details
Closed on
Dec 9, 2005
Sold by
Turner William Milton
Bought by
Homecomings Financial Network Inc
Purchase Details
Closed on
Mar 5, 2004
Sold by
Kirby Marshburn Bldg Corp
Bought by
Turner William Milton
Home Financials for this Owner
Home Financials are based on the most recent Mortgage that was taken out on this home.
Original Mortgage
$105,800
Interest Rate
6.87%
Mortgage Type
Purchase Money Mortgage
Purchase Details
Closed on
Dec 20, 2002
Sold by
Eastwind Development Llc
Bought by
Kirby Marshburn Bldg Corp
Create a Home Valuation Report for This Property
The Home Valuation Report is an in-depth analysis detailing your home's value as well as a comparison with similar homes in the area
Home Values in the Area
Average Home Value in this Area
Purchase History
| Date | Buyer | Sale Price | Title Company |
|---|---|---|---|
| Rodriguez Carlos Y | $102,500 | None Available | |
| Homecomings Financial Network Inc | $89,165 | None Available | |
| Turner William Milton | $106,000 | -- | |
| Kirby Marshburn Bldg Corp | $40,000 | -- |
Source: Public Records
Mortgage History
| Date | Status | Borrower | Loan Amount |
|---|---|---|---|
| Open | Rodriguez Carlos Y | $82,000 | |
| Closed | Rodriguez Carlos Y | $20,500 | |
| Previous Owner | Turner William Milton | $105,800 |
Source: Public Records
Tax History Compared to Growth
Tax History
| Year | Tax Paid | Tax Assessment Tax Assessment Total Assessment is a certain percentage of the fair market value that is determined by local assessors to be the total taxable value of land and additions on the property. | Land | Improvement |
|---|---|---|---|---|
| 2025 | $1,615 | $249,364 | $70,000 | $179,364 |
| 2024 | $1,569 | $249,364 | $70,000 | $179,364 |
| 2023 | $1,296 | $163,605 | $40,000 | $123,605 |
| 2022 | $1,202 | $163,605 | $40,000 | $123,605 |
| 2021 | $1,170 | $163,605 | $40,000 | $123,605 |
| 2020 | $1,151 | $163,605 | $40,000 | $123,605 |
| 2019 | $983 | $117,951 | $30,000 | $87,951 |
| 2018 | $905 | $117,951 | $30,000 | $87,951 |
| 2017 | $859 | $117,951 | $30,000 | $87,951 |
| 2016 | $842 | $117,951 | $30,000 | $87,951 |
| 2015 | $869 | $122,233 | $30,000 | $92,233 |
| 2014 | $824 | $122,233 | $30,000 | $92,233 |
Source: Public Records
Map
Nearby Homes
- 3061 Van Dorn Rd
- 2201 Ballston Place
- 520 Folk Song Way
- 532 Frampton Way
- 1112 Amber Acres Ln
- 1172 Cottonsprings Dr
- 1132 Amber Acres Ln
- 1156 Cottonsprings Dr
- 1146 Cottonsprings Dr
- 1142 Cottonsprings Dr
- Park Ave Plan at Wendell Falls - Townhome Collection
- Manhattan Plan at Wendell Falls - Townhome Collection
- Greenwich Plan at Wendell Falls - Townhome Collection
- Lincoln Plan at Wendell Falls - Townhome Collection
- Scissors Plan at Wendell Falls - Roshambo Collection
- Found a Dream Plan at Wendell Falls - Playlist Collection
- Paper Plan at Wendell Falls - Roshambo Collection
- Shoot Plan at Wendell Falls - Roshambo Collection
- Southbound Train Plan at Wendell Falls - Playlist Collection
- Castle in Brooklyn Plan at Wendell Falls - Playlist Collection
- 2049 Ballston Place
- 2041 Ballston Place
- 3040 Van Dorn Rd
- 3036 Van Dorn Rd
- 2053 Ballston Place
- 2037 Ballston Place
- 3044 Van Dorn Rd
- 2048 Ballston Place
- 3032 Van Dorn Rd
- 2044 Ballston Place
- 2052 Ballston Place
- 3048 Van Dorn Rd
- 2057 Ballston Place
- 2033 Ballston Place
- 2040 Ballston Place
- 2056 Ballston Place
- 3028 Van Dorn Rd
- 3052 Van Dorn Rd
- 2036 Ballston Place
- 2060 Ballston Place