M
Seller's Agent in 2025
Marta Hall
Coldwell Banker Realty
(760) 809-7131
2 in this area
17 Total Sales
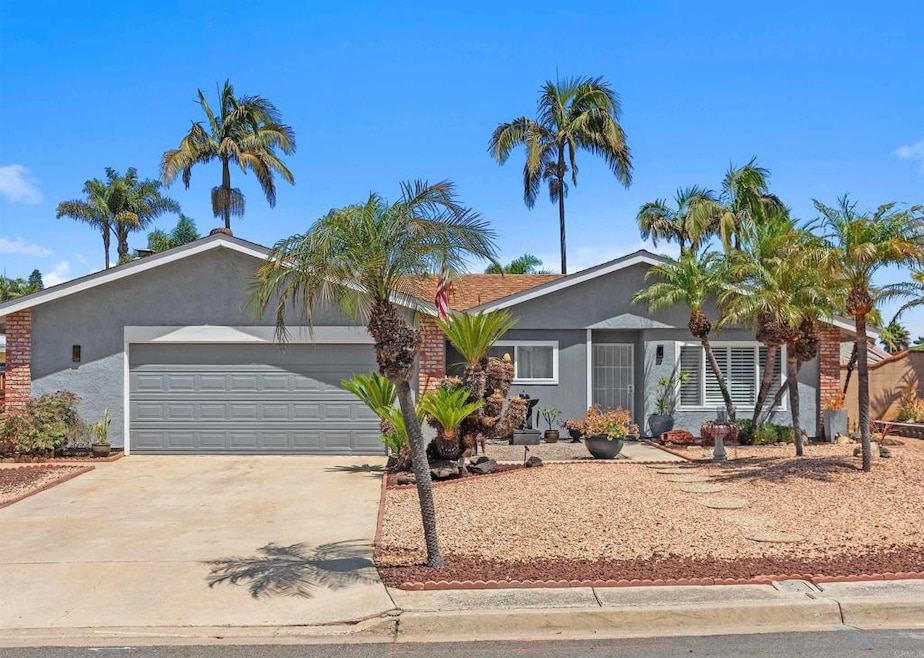
Single-level beauty in the highly sought-after Fire Mountain neighborhood. This meticulously maintained home offers move-in ready comfort. The 3-bedroom, 2 bath residence has been thoughtfully updated throughout. Upon entering, the plank vinyl flooring, louvered shutters and vaulted ceilings greet you. The remodeled kitchen features sleek stainless steel LG appliances & a farmhouse sink. Both bathrooms have been tastefully renovated with modern finishes & the bedrooms offer a cozy retreat with plush new carpeting. The family room features an eye-catching arched fireplace, adding a touch of architectural interest. The dual-paned windows and sliding doors flood the home with abundant natural light. You'll also appreciate the skylights, the tankless water heater and the convenience of a 2.5 car garage, providing extra space for vehicles and storage. Situated on a generous 10,000+ square foot lot, the private, enclosed backyard is sprawling. It features a luxurious hot tub, 2 sheds and is beautifully landscaped. It’s truly full of possibilities, offering ample space for outdoor living, entertaining, adding a pool, ADU or creating your dream garden oasis. It also has access for an additional vehicle in the backyard. Close to shopping, freeway access, Oceanside’s vibrant dining scene and the incredible North County beaches, this fabulous home perfectly blends comfort, style, and an unbeatable location!
Last Agent to Sell the Property
Coldwell Banker Realty Brokerage Email: martahall888@gmail.com License #00598173 Listed on: 06/19/2025

Co-Listed By
Coldwell Banker Realty Brokerage Email: martahall888@gmail.com License #02157348
Last Buyer's Agent
Joy Eunsook Chiu
US Realty License #01504331
| Date | Type | Sale Price | Title Company |
|---|---|---|---|
| Grant Deed | $1,325,000 | Ticor Title Company | |
| Grant Deed | -- | None Listed On Document | |
| Grant Deed | -- | None Listed On Document | |
| Grant Deed | $570,000 | Chicago Title Co |
| Date | Status | Loan Amount | Loan Type |
|---|---|---|---|
| Open | $595,000 | New Conventional | |
| Previous Owner | $456,000 | Negative Amortization |
| Date | Event | Price | List to Sale | Price per Sq Ft |
|---|---|---|---|---|
| 11/13/2025 11/13/25 | Sold | $1,325,000 | 0.0% | $821 / Sq Ft |
| 09/18/2025 09/18/25 | Pending | -- | -- | -- |
| 08/25/2025 08/25/25 | Price Changed | $1,325,000 | -5.3% | $821 / Sq Ft |
| 06/19/2025 06/19/25 | For Sale | $1,398,600 | -- | $867 / Sq Ft |
| Year | Tax Paid | Tax Assessment Tax Assessment Total Assessment is a certain percentage of the fair market value that is determined by local assessors to be the total taxable value of land and additions on the property. | Land | Improvement |
|---|---|---|---|---|
| 2025 | $8,682 | $794,470 | $557,524 | $236,946 |
| 2024 | $8,682 | $778,893 | $546,593 | $232,300 |
| 2023 | $8,413 | $763,622 | $535,876 | $227,746 |
| 2022 | $8,285 | $748,650 | $525,369 | $223,281 |
| 2021 | $8,316 | $733,971 | $515,068 | $218,903 |
| 2020 | $8,058 | $726,446 | $509,787 | $216,659 |
| 2019 | $7,822 | $712,203 | $499,792 | $212,411 |
| 2018 | $7,201 | $650,000 | $380,000 | $270,000 |
| 2017 | $6,653 | $600,000 | $351,000 | $249,000 |
| 2016 | $6,016 | $550,000 | $322,000 | $228,000 |
| 2015 | $5,495 | $510,000 | $299,000 | $211,000 |
| 2014 | $4,750 | $450,000 | $264,000 | $186,000 |
M
Seller's Agent in 2025
Marta Hall
Coldwell Banker Realty
(760) 809-7131
2 in this area
17 Total Sales
K
Seller Co-Listing Agent in 2025
Karen DeLozier
Coldwell Banker Realty
(901) 412-2002
2 in this area
9 Total Sales
J
Buyer's Agent in 2025
Joy Eunsook Chiu
US Realty
T
Buyer's Agent in 2025
Teresa Pecson
HomeSmart Realty West
Source: California Regional Multiple Listing Service (CRMLS)
MLS Number: NDP2506037
APN: 151-200-37
Disclaimer: Certain information contained herein is derived from information provided by parties other than Homes.com. All information provided is deemed reliable, but is not guaranteed to be accurate and should be independently verified.
![]() The multiple listing data appearing on this website, or contained in reports produced therefrom, is owned and copyrighted by California Regional Multiple Listing Service, Inc. ("CRMLS") and is protected by all applicable copyright laws. Information provided is for viewer's personal, non-commercial use and may not be used for any purpose other than to identify prospective properties the viewer may be interested in purchasing. All listing data, including but not limited to square footage and lot size is believed to be accurate, but the listing Agent, listing Broker and CRMLS and its affiliates do not warrant or guarantee such accuracy. The viewer should independently verify the listed data prior to making any decisions based on such information by personal inspection and/or contacting a real estate professional.
The multiple listing data appearing on this website, or contained in reports produced therefrom, is owned and copyrighted by California Regional Multiple Listing Service, Inc. ("CRMLS") and is protected by all applicable copyright laws. Information provided is for viewer's personal, non-commercial use and may not be used for any purpose other than to identify prospective properties the viewer may be interested in purchasing. All listing data, including but not limited to square footage and lot size is believed to be accurate, but the listing Agent, listing Broker and CRMLS and its affiliates do not warrant or guarantee such accuracy. The viewer should independently verify the listed data prior to making any decisions based on such information by personal inspection and/or contacting a real estate professional.
Based on information from California Regional Multiple Listing Service, Inc. and /or other sources. All data, including all measurements and calculations of area, is obtained from various sources and has not been, and will not be, verified by broker or MLS. All information should be independently reviewed and verified for accuracy. Properties may or may not be listed by the office/agent presenting the information
Ask me questions while you tour the home.