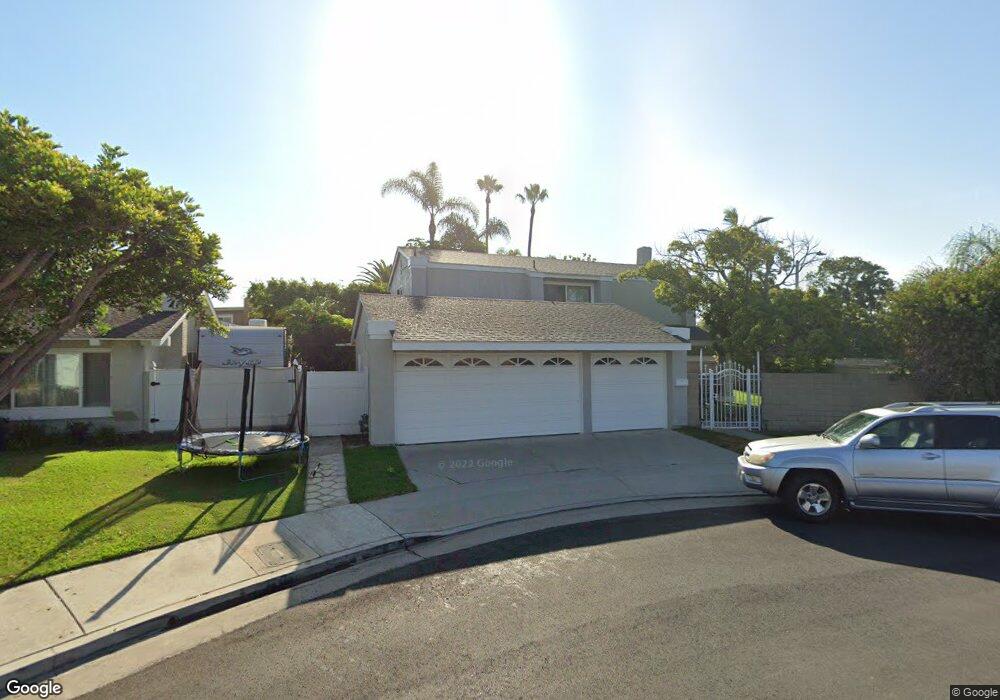
20472 Drew Cir Huntington Beach, CA 92646
Southeast NeighborhoodEstimated Value: $1,440,876 - $1,625,000
4
Beds
3
Baths
1,700
Sq Ft
$918/Sq Ft
Est. Value
About This Home
This home is located at 20472 Drew Cir, Huntington Beach, CA 92646 and is currently estimated at $1,560,219, approximately $917 per square foot. 20472 Drew Cir is a home located in Orange County with nearby schools including S.A. Moffett Elementary School, Isaac L. Sowers Middle School, and Edison High School.
Ownership History
Date
Name
Owned For
Owner Type
Purchase Details
Closed on
Jan 20, 2012
Sold by
Fox Andrew W and Fox Tania Smith
Bought by
Fox Andrew W
Current Estimated Value
Home Financials for this Owner
Home Financials are based on the most recent Mortgage that was taken out on this home.
Original Mortgage
$200,000
Outstanding Balance
$22,845
Interest Rate
3.88%
Mortgage Type
New Conventional
Estimated Equity
$1,537,374
Purchase Details
Closed on
Jan 6, 2012
Sold by
Fox Tania Smith
Bought by
Fox Andrew William
Home Financials for this Owner
Home Financials are based on the most recent Mortgage that was taken out on this home.
Original Mortgage
$200,000
Outstanding Balance
$22,845
Interest Rate
3.88%
Mortgage Type
New Conventional
Estimated Equity
$1,537,374
Purchase Details
Closed on
Jul 15, 1999
Sold by
Security Trust Company
Bought by
Fox Andrew W
Purchase Details
Closed on
Dec 23, 1996
Sold by
Great Western Bank Fsb
Bought by
Ocwen Federal Bank Fsb
Purchase Details
Closed on
Dec 19, 1996
Sold by
Kassem Meshkat
Bought by
Great Western Bank Fsb
Create a Home Valuation Report for This Property
The Home Valuation Report is an in-depth analysis detailing your home's value as well as a comparison with similar homes in the area
Home Values in the Area
Average Home Value in this Area
Purchase History
| Date | Buyer | Sale Price | Title Company |
|---|---|---|---|
| Fox Andrew W | -- | First American Title Company | |
| Fox Andrew William | -- | None Available | |
| Fox Andrew W | -- | Chicago Title Co | |
| Ocwen Federal Bank Fsb | -- | Fidelity National Title Ins | |
| Great Western Bank Fsb | $171,425 | Chicago Title Co |
Source: Public Records
Mortgage History
| Date | Status | Borrower | Loan Amount |
|---|---|---|---|
| Open | Fox Andrew William | $200,000 |
Source: Public Records
Tax History Compared to Growth
Tax History
| Year | Tax Paid | Tax Assessment Tax Assessment Total Assessment is a certain percentage of the fair market value that is determined by local assessors to be the total taxable value of land and additions on the property. | Land | Improvement |
|---|---|---|---|---|
| 2025 | $4,775 | $405,461 | $232,932 | $172,529 |
| 2024 | $4,775 | $397,511 | $228,364 | $169,147 |
| 2023 | $4,666 | $389,717 | $223,886 | $165,831 |
| 2022 | $4,543 | $382,076 | $219,496 | $162,580 |
| 2021 | $4,395 | $368,635 | $215,192 | $153,443 |
| 2020 | $4,366 | $364,856 | $212,986 | $151,870 |
| 2019 | $4,316 | $357,702 | $208,809 | $148,893 |
| 2018 | $4,250 | $350,689 | $204,715 | $145,974 |
| 2017 | $4,194 | $343,813 | $200,701 | $143,112 |
| 2016 | $4,014 | $337,072 | $196,766 | $140,306 |
| 2015 | $3,974 | $332,009 | $193,810 | $138,199 |
| 2014 | $3,892 | $325,506 | $190,014 | $135,492 |
Source: Public Records
Map
Nearby Homes
- 8565 Trinity Cir Unit 824D
- 8646 Butte Cir Unit 607E
- 8565 Colusa Cir Unit 906C
- 8886 Plumas Cir Unit 1124-A
- 8565 Larkhall Cir Unit 804A
- 8856 Sutter Cir Unit 522A
- 8856 526C Sutter
- 20191 Imperial Cove Ln
- 20251 Lighthouse Ln
- 8566 Larkhall Cir Unit 808A
- 8566 Larkhall Cir Unit 809D
- 8342 Seaport Dr
- 8777 Tulare Dr Unit 409D
- 8472 Norfolk Dr
- 20131 Crown Reef Ln
- 8932 Amador Cir Unit 1309B
- 8788 Coral Springs Ct Unit 203
- 20258 Lantana Dr
- 20302 Tidepool Cir Unit 204
- 20162 S New Britain Ln
- 20462 Drew Cir
- 20461 Camfield Ln
- 20442 Drew Cir
- 20441 Camfield Ln
- 20471 Drew Cir
- 8672 Charford Dr
- 20461 Drew Cir
- 20432 Drew Cir
- 20441 Drew Cir
- 20431 Camfield Ln
- 8682 Charford Dr
- 20431 Drew Cir
- 20472 Regal Cir
- 20412 Drew Cir
- 20462 Regal Cir
- 20411 Camfield Ln
- 20442 Regal Cir
- 8681 Charford Dr
- 8692 Charford Dr
- 20411 Drew Cir