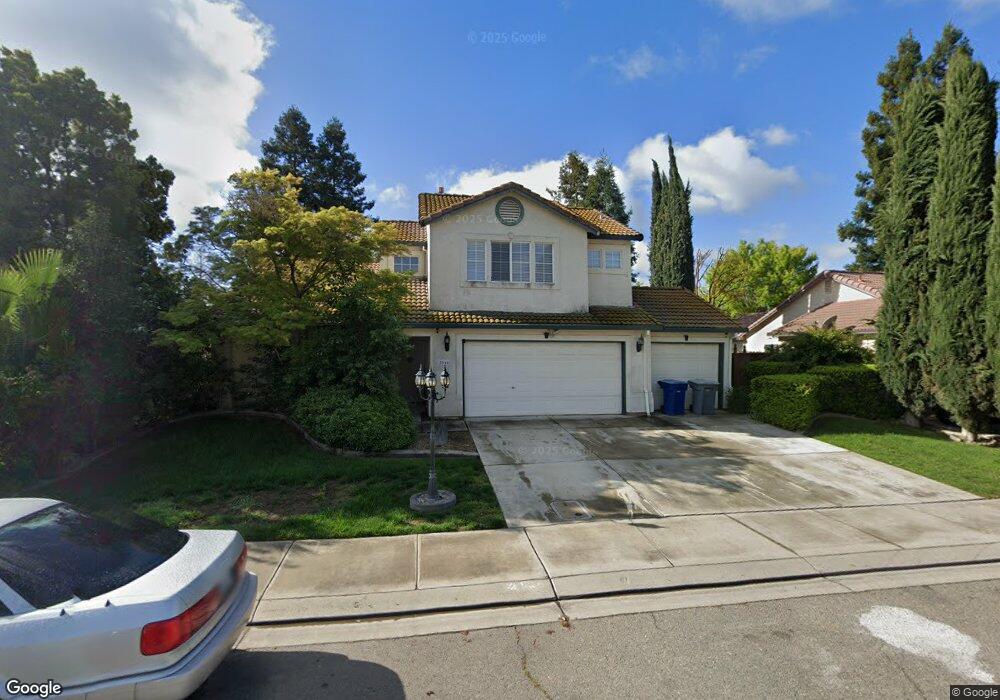
2048 Spy Glass Ct Unit 3 Merced, CA 95340
North Merced NeighborhoodEstimated Value: $460,240 - $506,000
4
Beds
3
Baths
1,917
Sq Ft
$255/Sq Ft
Est. Value
About This Home
This home is located at 2048 Spy Glass Ct Unit 3, Merced, CA 95340 and is currently estimated at $488,560, approximately $254 per square foot. 2048 Spy Glass Ct Unit 3 is a home located in Merced County with nearby schools including Donn B. Chenoweth Elementary School, Herbert H. Cruickshank Middle School, and Golden Valley High School.
Ownership History
Date
Name
Owned For
Owner Type
Purchase Details
Closed on
Sep 24, 2021
Sold by
Gray Brian P and Gray Leona P
Bought by
Gray Brian P and Gray Leona P
Current Estimated Value
Purchase Details
Closed on
Jan 31, 2012
Sold by
Op Development Inc
Bought by
Gray Brian P and Gray Leona P
Purchase Details
Closed on
Jun 16, 2011
Sold by
Pascal Michael and Pascal Rebecca
Bought by
Op Development Inc
Purchase Details
Closed on
Jan 30, 2009
Sold by
Pascal Michael and Pascal Rebecca
Bought by
Deutsche Bank National Trust Company
Purchase Details
Closed on
Sep 16, 1997
Sold by
Heritage Homes Llc
Bought by
Pascal Michael and Pascal Rebecca
Home Financials for this Owner
Home Financials are based on the most recent Mortgage that was taken out on this home.
Original Mortgage
$112,720
Interest Rate
8.25%
Mortgage Type
Purchase Money Mortgage
Create a Home Valuation Report for This Property
The Home Valuation Report is an in-depth analysis detailing your home's value as well as a comparison with similar homes in the area
Home Values in the Area
Average Home Value in this Area
Purchase History
| Date | Buyer | Sale Price | Title Company |
|---|---|---|---|
| Gray Brian P | -- | None Available | |
| Cray Brian P | -- | None Available | |
| Gray Brian P | $180,000 | Transcounty Title Company | |
| Op Development Inc | $147,000 | None Available | |
| Deutsche Bank National Trust Company | $140,250 | None Available | |
| Pascal Michael | $141,000 | Transcounty Title Company |
Source: Public Records
Mortgage History
| Date | Status | Borrower | Loan Amount |
|---|---|---|---|
| Previous Owner | Pascal Michael | $112,720 | |
| Closed | Pascal Michael | $28,180 |
Source: Public Records
Tax History Compared to Growth
Tax History
| Year | Tax Paid | Tax Assessment Tax Assessment Total Assessment is a certain percentage of the fair market value that is determined by local assessors to be the total taxable value of land and additions on the property. | Land | Improvement |
|---|---|---|---|---|
| 2025 | $2,566 | $226,078 | $13,810 | $212,268 |
| 2024 | $2,566 | $221,646 | $13,540 | $208,106 |
| 2023 | $2,527 | $217,301 | $13,275 | $204,026 |
| 2022 | $2,483 | $213,041 | $13,015 | $200,026 |
| 2021 | $2,464 | $208,864 | $12,760 | $196,104 |
| 2020 | $2,449 | $206,724 | $12,630 | $194,094 |
| 2019 | $2,422 | $202,672 | $12,383 | $190,289 |
| 2018 | $2,209 | $198,699 | $12,141 | $186,558 |
| 2017 | $2,270 | $194,803 | $11,903 | $182,900 |
| 2016 | $2,235 | $190,984 | $11,670 | $179,314 |
| 2015 | $2,187 | $188,116 | $11,495 | $176,621 |
| 2014 | $2,154 | $184,432 | $11,270 | $173,162 |
Source: Public Records
Map
Nearby Homes
- 2068 Spy Glass Ct
- 2049 Spy Glass Ct
- 1958 Fall Brook Ct
- 3391 Locksley Ct
- 3526 Veranda Ct
- 3320 Banbury Ln
- 3474 Cascade Creek Ave
- 2378 Aviles
- 2364 River Rock Dr
- 2409 Explorador Dr
- 1220 E Donna Dr
- 2428 Freestone Dr
- 3914 Palmer Ct
- 2465 Pineda Dr
- 2291 Dayna Way
- 3894 Avocet Dr
- 1073 El Portal Dr
- 3246 Shamrock Ave
- 3221 Dublin Ave
- 1046 Century Dr
- 2028 Spy Glass Ct
- 3514 Cypress Point Dr
- 3507 Capilano Ct
- 2078 Spy Glass Ct
- 2069 Spy Glass Ct
- 2019 Silverado Ave
- 2029 Spy Glass Ct
- 2079 Spy Glass Ct
- 2098 Spy Glass Ct
- 3503 Capilano Ct
- 1994 Woodhaven Ct
- 2099 Spy Glass Ct
- 3517 Cypress Point Dr
- 1995 Silverado Ave
- 2042 Legends Ct
- 2108 Spy Glass Ct
- 3514 Capilano Ct
- 1997 Woodhaven Ct
- 2072 Legends Ct
- 2109 Spy Glass Ct