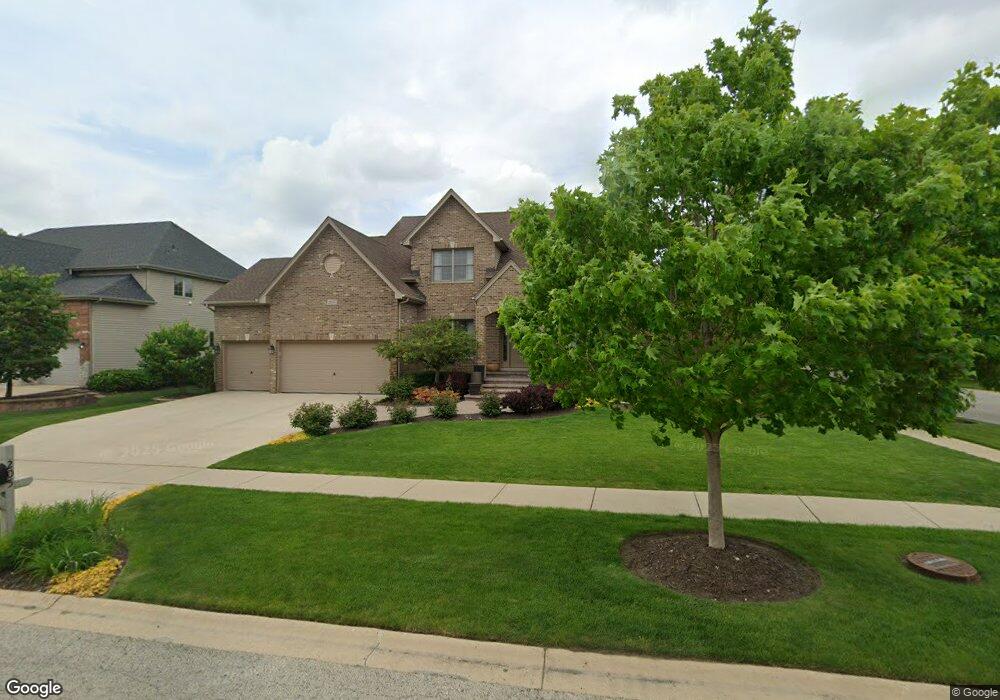
205 Amherst Cir Oswego, IL 60543
South Oswego NeighborhoodEstimated Value: $547,188 - $601,000
4
Beds
3
Baths
2,596
Sq Ft
$221/Sq Ft
Est. Value
About This Home
This home is located at 205 Amherst Cir, Oswego, IL 60543 and is currently estimated at $573,297, approximately $220 per square foot. 205 Amherst Cir is a home located in Kendall County with nearby schools including Prairie Point Elementary School, Traughber Junior High School, and Oswego High School.
Ownership History
Date
Name
Owned For
Owner Type
Purchase Details
Closed on
Jan 22, 2018
Sold by
Kipper Daniel L and Kipper Angela K
Bought by
Kipper Daniel L and Kipper Angela K
Current Estimated Value
Purchase Details
Closed on
Apr 28, 2006
Sold by
T J Baumgartner Custom Homes Corp
Bought by
Kipper Daniel L and Kipper Angela K
Home Financials for this Owner
Home Financials are based on the most recent Mortgage that was taken out on this home.
Original Mortgage
$307,000
Outstanding Balance
$177,700
Interest Rate
6.39%
Mortgage Type
Fannie Mae Freddie Mac
Estimated Equity
$395,597
Purchase Details
Closed on
Sep 29, 2005
Sold by
Deerpath Trails Development Llc
Bought by
T J Baumgartner Custom Homes Corp
Create a Home Valuation Report for This Property
The Home Valuation Report is an in-depth analysis detailing your home's value as well as a comparison with similar homes in the area
Home Values in the Area
Average Home Value in this Area
Purchase History
| Date | Buyer | Sale Price | Title Company |
|---|---|---|---|
| Kipper Daniel L | -- | None Available | |
| Kipper Daniel L | $395,500 | Chicago Title Insurance Comp | |
| T J Baumgartner Custom Homes Corp | $334,000 | Chicago Title Insurance Comp |
Source: Public Records
Mortgage History
| Date | Status | Borrower | Loan Amount |
|---|---|---|---|
| Open | Kipper Daniel L | $307,000 |
Source: Public Records
Tax History Compared to Growth
Tax History
| Year | Tax Paid | Tax Assessment Tax Assessment Total Assessment is a certain percentage of the fair market value that is determined by local assessors to be the total taxable value of land and additions on the property. | Land | Improvement |
|---|---|---|---|---|
| 2024 | $12,883 | $166,086 | $28,817 | $137,269 |
| 2023 | $12,087 | $149,627 | $25,961 | $123,666 |
| 2022 | $12,087 | $139,839 | $24,263 | $115,576 |
| 2021 | $11,668 | $130,691 | $22,676 | $108,015 |
| 2020 | $11,084 | $123,293 | $21,392 | $101,901 |
| 2019 | $11,260 | $123,293 | $21,392 | $101,901 |
| 2018 | $11,632 | $123,293 | $21,392 | $101,901 |
| 2017 | $11,539 | $118,551 | $20,569 | $97,982 |
| 2016 | $11,064 | $112,371 | $19,497 | $92,874 |
| 2015 | $11,076 | $107,532 | $18,657 | $88,875 |
| 2014 | -- | $101,445 | $17,601 | $83,844 |
| 2013 | -- | $101,445 | $17,601 | $83,844 |
Source: Public Records
Map
Nearby Homes
- 2489 Semillon St
- 2486 Semillon St
- 2319 Hirsch Dr
- 612 Murdock Place
- 2492 Semillon St
- 2259 Riesling Rd
- 2255 Riesling Rd
- 2501 Semillon St
- 6115 Rt 34
- 2261 Riesling Rd
- 2249 Riesling Rd
- 777 Dartmouth Ln
- 770 Dartmouth Ln
- 851 Claridge Dr
- 673 Cumberland Ln
- 668 Cumberland Ln
- 676 Cumberland Ln
- 210 Dorset Ave
- 639 Vista Dr
- 482 Deerfield Dr
- 207 Amherst Cir
- 301 Greenwood Place
- 203 Amherst Cir
- 303 Greenwood Place
- 209 Amherst Cir
- 200 Amherst Cir
- 202 Amherst Cir
- 279 Ashcroft Ct Unit 1
- 305 Greenwood Place Unit 1
- 198 Amherst Cir
- 201 Amherst Cir
- 204 Amherst Cir
- 211 Amherst Cir
- 307 Greenwood Place Unit 1
- 196 Amherst Cir
- 277 Ashcroft Ct Unit 1
- 270 Ashcroft Ln Unit 1
- 199 Amherst Cir
- 213 Amherst Ct
- 414 Deerfield Dr