Estimated Value: $400,000 - $422,000
3
Beds
1
Bath
1,080
Sq Ft
$378/Sq Ft
Est. Value
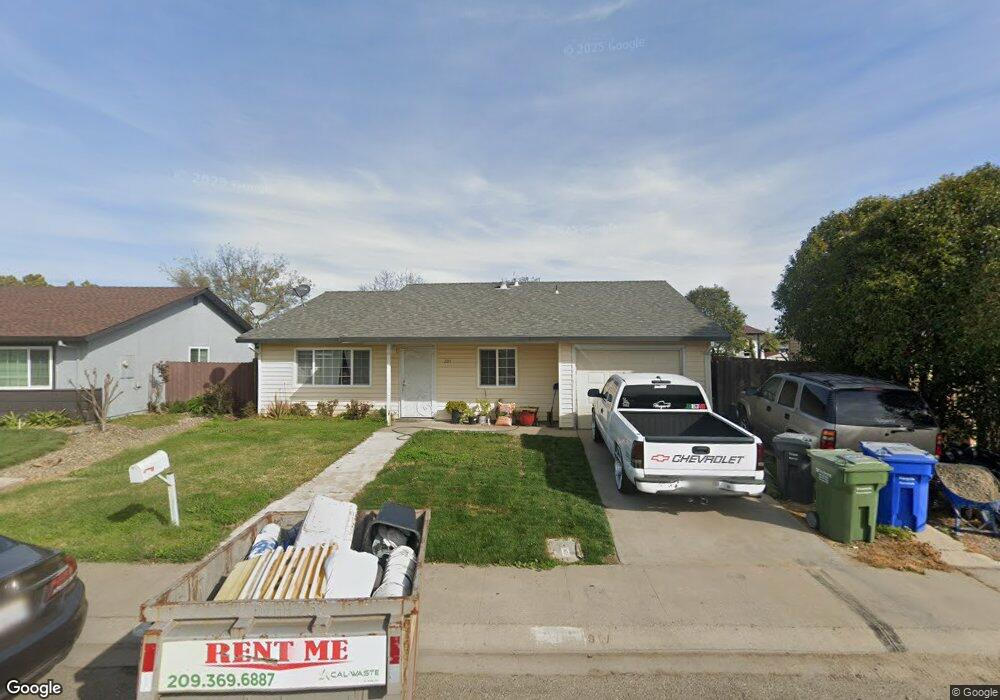
About This Home
This home is located at 205 Carlo Ct, Galt, CA 95632 and is currently estimated at $408,215, approximately $377 per square foot. 205 Carlo Ct is a home located in Sacramento County with nearby schools including Valley Oaks Elementary School, Robert L. McCaffrey Middle School, and Galt High School.
Ownership History
Date
Name
Owned For
Owner Type
Purchase Details
Closed on
Dec 28, 2018
Sold by
Sambajon Ulysses and Sambajon Adelia
Bought by
Sambajon Ulysses A and Sambajon Adelia R
Current Estimated Value
Purchase Details
Closed on
Dec 28, 2006
Sold by
Sambajon Ulysses
Bought by
Sambajon Ulysses and Sambajon Adelia
Home Financials for this Owner
Home Financials are based on the most recent Mortgage that was taken out on this home.
Original Mortgage
$260,000
Outstanding Balance
$166,220
Interest Rate
7.5%
Mortgage Type
New Conventional
Estimated Equity
$241,995
Purchase Details
Closed on
Nov 3, 2006
Sold by
Montanez Torres Jorge and Montanez Torres Carmen
Bought by
Sambajon Ulysses
Home Financials for this Owner
Home Financials are based on the most recent Mortgage that was taken out on this home.
Original Mortgage
$260,000
Outstanding Balance
$166,220
Interest Rate
7.5%
Mortgage Type
New Conventional
Estimated Equity
$241,995
Create a Home Valuation Report for This Property
The Home Valuation Report is an in-depth analysis detailing your home's value as well as a comparison with similar homes in the area
Home Values in the Area
Average Home Value in this Area
Purchase History
| Date | Buyer | Sale Price | Title Company |
|---|---|---|---|
| Sambajon Ulysses A | -- | None Available | |
| Sambajon Ulysses | -- | North American Title Co | |
| Sambajon Ulysses | $115,000 | None Available |
Source: Public Records
Mortgage History
| Date | Status | Borrower | Loan Amount |
|---|---|---|---|
| Open | Sambajon Ulysses | $260,000 |
Source: Public Records
Tax History
| Year | Tax Paid | Tax Assessment Tax Assessment Total Assessment is a certain percentage of the fair market value that is determined by local assessors to be the total taxable value of land and additions on the property. | Land | Improvement |
|---|---|---|---|---|
| 2025 | $4,349 | $395,221 | $133,968 | $261,253 |
| 2024 | $4,349 | $387,473 | $131,342 | $256,131 |
| 2023 | $4,276 | $379,876 | $128,767 | $251,109 |
| 2022 | $4,104 | $372,429 | $126,243 | $246,186 |
| 2021 | $2,622 | $233,026 | $103,565 | $129,461 |
| 2020 | $2,305 | $204,410 | $90,847 | $113,563 |
| 2019 | $2,153 | $191,935 | $85,303 | $106,632 |
| 2018 | $2,108 | $184,554 | $82,023 | $102,531 |
| 2017 | $1,878 | $167,777 | $74,567 | $93,210 |
| 2016 | $1,673 | $152,526 | $67,789 | $84,737 |
| 2015 | $1,577 | $146,660 | $65,182 | $81,478 |
| 2014 | $1,472 | $134,550 | $59,800 | $74,750 |
Source: Public Records
Map
Nearby Homes
- 1100 Tudor St
- 667 Germaine Dr
- 105 Kent St
- 700 2nd St Unit 40
- 700 2nd St Unit 14
- 718 Crow Creek Cir
- 881 Spur Way
- 461 F St
- 712 Church St
- 0 B St Unit 226013319
- 240 3rd St
- 433 5th St
- 515 E St
- 1241 Wilder Way
- 14076 Saradale Ln
- 236 Sasha Rose Dr
- 954 Stampede Trail
- 14130 Sargent Ave
- 150 Spruce Ave
- 26572 N Lower Sacramento Rd
- 209 Carlo Ct
- 201 Carlo Ct
- 1016 Meadowview Dr
- 213 Carlo Ct
- 214 Creekside Way
- 210 Creekside Way
- 1100 Meadowview Dr
- 218 Creekside Way
- 1100 Meadow View Dr
- 206 Creekside Way
- 202 Creekside Way
- 215 Carlo Ct
- 1021 Meadowview Dr
- 1017 Meadowview Dr
- 1104 Meadowview Dr
- 206 Carlo Ct
- 222 Creekside Way
- 1013 Meadowview Dr
- 1101 Meadowview Dr
- 210 Carlo Ct
Your Personal Tour Guide
Ask me questions while you tour the home.