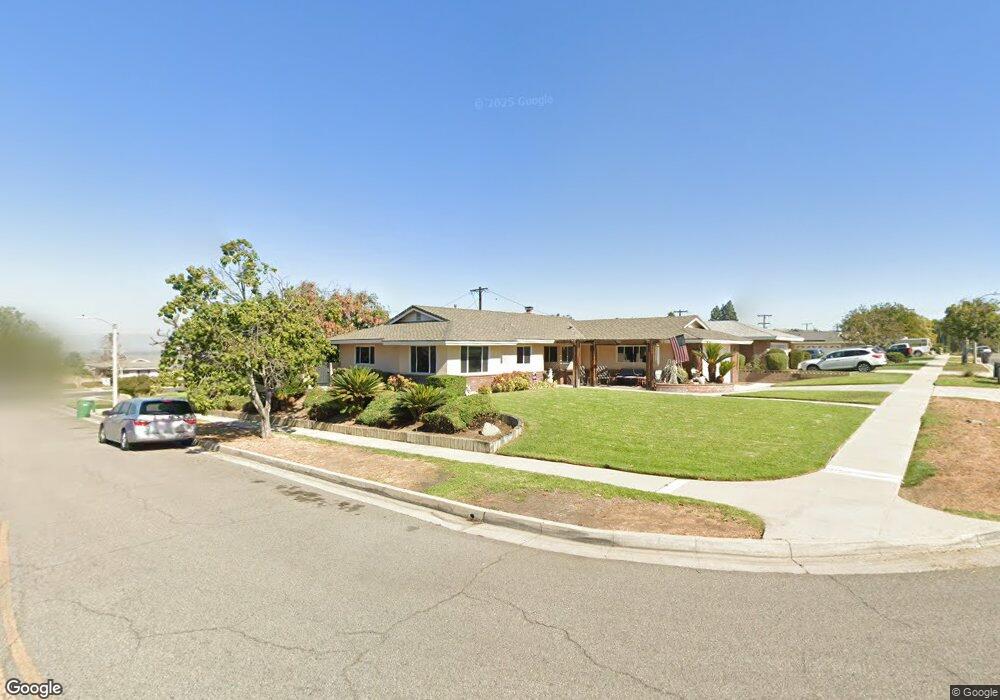
205 E Monterey Rd Corona, CA 92879
Central Corona NeighborhoodEstimated Value: $629,000 - $691,000
3
Beds
2
Baths
1,417
Sq Ft
$464/Sq Ft
Est. Value
About This Home
This home is located at 205 E Monterey Rd, Corona, CA 92879 and is currently estimated at $658,032, approximately $464 per square foot. 205 E Monterey Rd is a home located in Riverside County with nearby schools including Garretson Elementary School, Auburndale Intermediate, and Centennial High School.
Ownership History
Date
Name
Owned For
Owner Type
Purchase Details
Closed on
Dec 21, 2006
Sold by
Topping Traci L
Bought by
Topping Traci Lynn
Current Estimated Value
Purchase Details
Closed on
Aug 23, 2006
Sold by
Topping Traci and Topping Traci L
Bought by
Topping Traci
Purchase Details
Closed on
Mar 12, 2001
Sold by
Hennessey Kelly and Hennessey Janice L
Bought by
Topping Traci L
Home Financials for this Owner
Home Financials are based on the most recent Mortgage that was taken out on this home.
Original Mortgage
$160,000
Interest Rate
6.89%
Mortgage Type
Purchase Money Mortgage
Purchase Details
Closed on
Apr 17, 1997
Sold by
Messner Gary W and Messner Sharon L
Bought by
Hennessey Kelly and Hennessey Janice L
Home Financials for this Owner
Home Financials are based on the most recent Mortgage that was taken out on this home.
Original Mortgage
$128,886
Interest Rate
8.15%
Mortgage Type
FHA
Create a Home Valuation Report for This Property
The Home Valuation Report is an in-depth analysis detailing your home's value as well as a comparison with similar homes in the area
Home Values in the Area
Average Home Value in this Area
Purchase History
| Date | Buyer | Sale Price | Title Company |
|---|---|---|---|
| Topping Traci Lynn | -- | None Available | |
| Topping Traci | -- | Western Resource Title | |
| Topping Traci L | $200,000 | First American Title Co | |
| Hennessey Kelly | $130,000 | Lawyers Title Company |
Source: Public Records
Mortgage History
| Date | Status | Borrower | Loan Amount |
|---|---|---|---|
| Previous Owner | Topping Traci L | $160,000 | |
| Previous Owner | Hennessey Kelly | $128,886 |
Source: Public Records
Tax History
| Year | Tax Paid | Tax Assessment Tax Assessment Total Assessment is a certain percentage of the fair market value that is determined by local assessors to be the total taxable value of land and additions on the property. | Land | Improvement |
|---|---|---|---|---|
| 2025 | $3,341 | $301,341 | $75,328 | $226,013 |
| 2023 | $3,341 | $289,641 | $72,403 | $217,238 |
| 2022 | $3,236 | $283,963 | $70,984 | $212,979 |
| 2021 | $3,172 | $278,396 | $69,593 | $208,803 |
| 2020 | $3,138 | $275,542 | $68,880 | $206,662 |
| 2019 | $3,066 | $270,140 | $67,530 | $202,610 |
| 2018 | $2,998 | $264,844 | $66,206 | $198,638 |
| 2017 | $2,925 | $259,652 | $64,908 | $194,744 |
| 2016 | $2,897 | $254,562 | $63,636 | $190,926 |
| 2015 | $2,834 | $250,740 | $62,681 | $188,059 |
| 2014 | $2,732 | $245,830 | $61,454 | $184,376 |
Source: Public Records
Map
Nearby Homes
- 350 E Hacienda Dr
- 340 E Old Mill Rd
- 2014 Melba Ct
- 2163 Summerset St
- 2106 S Belle Ave
- 2102 Beatrice Dr
- 1710 Garretson Ave
- 2272 Mary Clare St
- 1925 S Starfire Ave
- 1429 Garretson Ave
- 2295 Shanna Carle Dr
- 1310 S Belle Ave
- 303 Sunburst Ln
- 701 W Crestview St
- 1153 E Grand Blvd
- 506 W Olive St
- 1185 W Grand Blvd
- 2097 Santa Barbara St
- 1211 S Merrill St
- 2172 Kellogg Ave
- 215 E Monterey Rd
- 206 Greengate St
- 216 Greengate St
- 225 E Monterey Rd
- 1930 Pamela St
- 1924 Pamela St
- 206 E Monterey Rd
- 202 E Monterey Rd
- 226 Greengate St
- 216 E Monterey Rd
- 160 Greengate St
- 1936 Pamela St
- 235 E Monterey Rd
- 226 E Monterey Rd
- 236 Greengate St
- 215 E Mission Rd
- 205 Greengate St
- 205 E Mission Rd
- 223 E Mission Rd
- 175 Greengate St
Your Personal Tour Guide
Ask me questions while you tour the home.