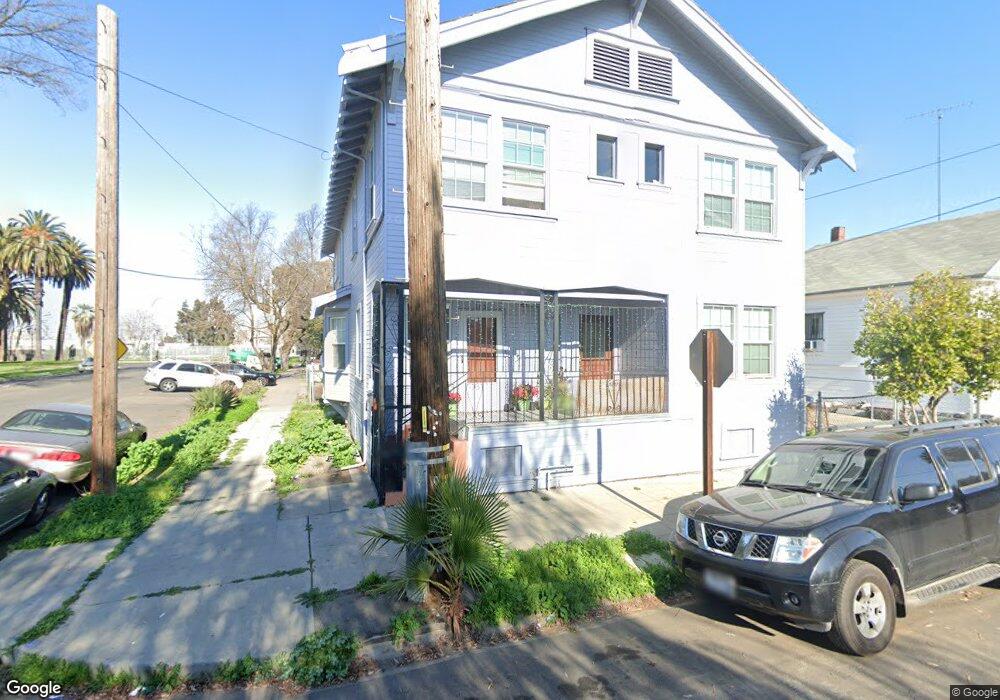
205 E Worth St Stockton, CA 95206
Seaport NeighborhoodEstimated Value: $236,000 - $413,276
8
Beds
2
Baths
2,900
Sq Ft
$118/Sq Ft
Est. Value
About This Home
This home is located at 205 E Worth St, Stockton, CA 95206 and is currently estimated at $342,319, approximately $118 per square foot. 205 E Worth St is a home located in San Joaquin County with nearby schools including Spanos (Alex G.) Elementary School, Hazelton Elementary School, and Dolores Huerta Elementary School.
Ownership History
Date
Name
Owned For
Owner Type
Purchase Details
Closed on
Nov 11, 2020
Sold by
Lan Ho Leng
Bought by
Lan Ho Leng
Current Estimated Value
Purchase Details
Closed on
Jul 29, 2019
Sold by
Lau Kai Fu
Bought by
Leng Lau Kai Fu and Leng Lan Ho
Purchase Details
Closed on
Feb 28, 2017
Sold by
Ian Ho Ieng
Bought by
Lau Kai Fu
Purchase Details
Closed on
Jul 15, 2014
Sold by
Lee Jennifer C and Chan Norman
Bought by
Zhang Wei Jing and Li Huiming
Purchase Details
Closed on
Dec 8, 2010
Sold by
Lee Calvin Q
Bought by
Lee Jennifer C
Purchase Details
Closed on
Aug 1, 1996
Sold by
Tom Oy Ha and Tom Wong Oy Ha
Bought by
Tom Oy Ha and Lew Bonnie Sue
Create a Home Valuation Report for This Property
The Home Valuation Report is an in-depth analysis detailing your home's value as well as a comparison with similar homes in the area
Home Values in the Area
Average Home Value in this Area
Purchase History
| Date | Buyer | Sale Price | Title Company |
|---|---|---|---|
| Lan Ho Leng | -- | None Available | |
| Leng Lau Kai Fu | -- | None Available | |
| Lau Kai Fu | -- | North American Title Co Inc | |
| Lau Kai Fu | $90,000 | North American Title Co Inc | |
| Li Huiming | -- | North American Title Co Inc | |
| Zhang Wei Jing | -- | North American Title Co Inc | |
| Zhang Wei Jing | $90,000 | Chicago Title Company | |
| Lee Jennifer C | -- | Chicago Title Company | |
| Lee Jennifer C | $55,000 | Chicago Title Company | |
| Tom Allen C | -- | Chicago Title Company | |
| Tom Oy Ha | -- | -- |
Source: Public Records
Tax History
| Year | Tax Paid | Tax Assessment Tax Assessment Total Assessment is a certain percentage of the fair market value that is determined by local assessors to be the total taxable value of land and additions on the property. | Land | Improvement |
|---|---|---|---|---|
| 2025 | $1,955 | $156,673 | $34,815 | $121,858 |
| 2024 | $1,925 | $153,602 | $34,133 | $119,469 |
| 2023 | $1,882 | $150,591 | $33,464 | $117,127 |
| 2022 | $1,858 | $147,639 | $32,808 | $114,831 |
| 2021 | $1,786 | $144,745 | $32,165 | $112,580 |
| 2020 | $1,820 | $143,262 | $31,836 | $111,426 |
| 2019 | $1,813 | $140,454 | $31,212 | $109,242 |
| 2018 | $1,780 | $137,700 | $30,600 | $107,100 |
| 2017 | $1,175 | $93,200 | $25,889 | $67,311 |
| 2016 | $1,196 | $91,372 | $25,381 | $65,991 |
| 2014 | $751 | $57,481 | $10,451 | $47,030 |
Source: Public Records
Map
Nearby Homes
- 446 E Anderson St
- 203 E Hazelton Ave
- 143 W Jefferson St
- 201 W Worth St
- 1215 S American St
- 329 S San Joaquin St
- 1516 S Hunter St
- 348 W Clay St
- 921 S Aurora St
- 1602 S Sutter St
- 520 W Jackson St
- 709 E Sonora St
- 143 S California St
- 1615 S Stanislaus St
- 739 E 2nd St
- 1731 S Center St
- 1121 E Clay St
- 1827 S California St
- 231 E 5th St
- 835 S Airport Way
- 215 E Worth St
- 840 S Hunter St
- 223 E Worth St
- 830 S Hunter St
- 204 E Worth St
- 210 E Worth St
- 218 E Worth St
- 227 E Worth St
- 820 S Hunter St
- 222 E Worth St
- 916 S Hunter St
- 818 S Hunter St
- 228 E Worth St
- 922 S Hunter St
- 845 S San Joaquin St
- 845 S San Joaquin St Unit A
- 245 E Worth St
- 835 S San Joaquin St
- 230 E Worth St
- 136 E Worth St
Your Personal Tour Guide
Ask me questions while you tour the home.