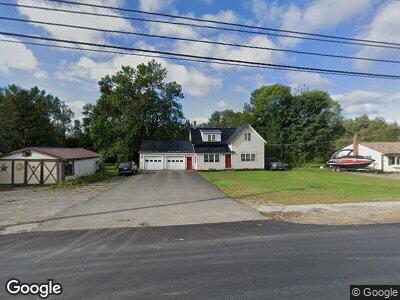
205 Elm St Newport, ME 04953
Newport NeighborhoodEstimated Value: $189,865 - $239,000
4
Beds
1
Bath
1,341
Sq Ft
$161/Sq Ft
Est. Value
About This Home
This home is located at 205 Elm St, Newport, ME 04953 and is currently estimated at $216,216, approximately $161 per square foot. 205 Elm St is a home located in Penobscot County with nearby schools including Sebasticook Valley Elementary School and Nokomis Regional Middle School/High School.
Ownership History
Date
Name
Owned For
Owner Type
Purchase Details
Closed on
Jun 17, 2005
Sold by
Davis Jeffery A and Brown Jamie R
Bought by
Elderkin Scott G and Elderkin Heather M
Current Estimated Value
Home Financials for this Owner
Home Financials are based on the most recent Mortgage that was taken out on this home.
Original Mortgage
$75,600
Interest Rate
5.78%
Mortgage Type
Purchase Money Mortgage
Create a Home Valuation Report for This Property
The Home Valuation Report is an in-depth analysis detailing your home's value as well as a comparison with similar homes in the area
Home Values in the Area
Average Home Value in this Area
Purchase History
| Date | Buyer | Sale Price | Title Company |
|---|---|---|---|
| Elderkin Scott G | -- | -- |
Source: Public Records
Mortgage History
| Date | Status | Borrower | Loan Amount |
|---|---|---|---|
| Open | Elderkin Scott G | $35,000 | |
| Open | Elderkin Heather M | $96,100 | |
| Closed | Elderkin Scott G | $5,225 | |
| Closed | Elderkin Scott G | $100,000 | |
| Closed | Elderkin Scott G | $75,600 | |
| Closed | Elderkin Scott G | $18,900 |
Source: Public Records
Tax History Compared to Growth
Tax History
| Year | Tax Paid | Tax Assessment Tax Assessment Total Assessment is a certain percentage of the fair market value that is determined by local assessors to be the total taxable value of land and additions on the property. | Land | Improvement |
|---|---|---|---|---|
| 2024 | $2,104 | $120,200 | $19,500 | $100,700 |
| 2023 | $1,830 | $112,300 | $18,200 | $94,100 |
| 2022 | $1,740 | $88,800 | $14,400 | $74,400 |
| 2021 | $1,747 | $84,800 | $13,700 | $71,100 |
| 2020 | $1,716 | $83,300 | $13,500 | $69,800 |
| 2019 | $1,672 | $78,500 | $12,700 | $65,800 |
| 2018 | $1,672 | $78,500 | $12,700 | $65,800 |
| 2017 | $122 | $78,500 | $12,700 | $65,800 |
| 2016 | $1,843 | $78,500 | $12,700 | $65,800 |
| 2015 | $1,405 | $78,500 | $12,700 | $65,800 |
| 2014 | $1,350 | $78,500 | $12,700 | $65,800 |
Source: Public Records
Map
Nearby Homes