
Seller's Agent in 2025
Shauna Covington
Berkshire Hathaway HomeServices California Properties
(949) 412-8088
14 in this area
91 Total Sales
This single-level North Laguna residence in the Tree Streets embodies timeless California coastal living with a rare blend of privacy, craftsmanship, and character. Resting on a secluded corner lot along the prestigious High Drive, the home is framed by lush hedges, mature trees, and curated gardens, setting a serene tone from the moment you arrive.
Behind the original front door, interiors reveal a meticulous attention to detail. Sunlight pours through an abundance of windows, highlighting refinished hardwood floors, custom Venetian plaster walls, hand-selected Alder wood doors, and exposed wood beams that echo the home’s architectural roots, originally built in 1937. Crown molding and crystal-accented Framburg lighting add a touch of classic elegance, while thoughtful updates ensure a seamless balance of historic charm and modern convenience.
The kitchen is both functional and refined, anchored by a generous island, Wolf range, subway tile backsplash, and double pantry. A custom bar area discreetly integrates a home theater system and Sonos multi-room audio, creating a space as ideal for entertaining as it is for everyday living. The primary suite offers tranquil views of mature landscaping and remodeled bath with a spacious walk-in shower and soaking tub. A secondary bedroom overlooks the deck through a striking bay window. Third bedroom overlooks front yard.
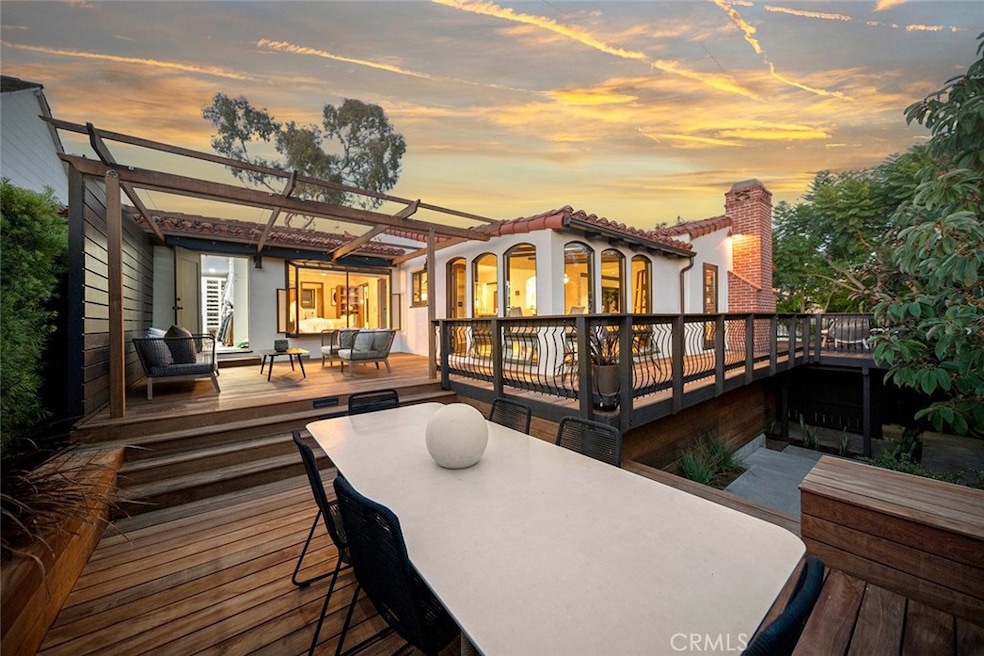
Outdoors, an IPE wood deck captures ocean views, while a covered patio invites year-round gatherings. Beneath the home, additional bonus space presents potential for expansion. Situated moments from Laguna Beach’s vibrant downtown, boutique shops, acclaimed restaurants, and world-renowned beaches in one of Laguna’s most coveted settings.
Last Agent to Sell the Property
Berkshire Hathaway HomeServices California Properties Brokerage Phone: 949-412-8088 License #00991380 Listed on: 09/15/2025
Co-Listed By
Berkshire Hathaway HomeServices California Properties Brokerage Phone: 949-412-8088 License #02109969
| Date | Type | Sale Price | Title Company |
|---|---|---|---|
| Grant Deed | $3,400,000 | Fidelity National Title Builde | |
| Quit Claim Deed | -- | Fidelity National Title | |
| Grant Deed | $2,175,000 | Equity Title | |
| Interfamily Deed Transfer | -- | None Available | |
| Grant Deed | $1,685,000 | Chicago Title Co Irvine | |
| Interfamily Deed Transfer | -- | -- |
| Date | Status | Loan Amount | Loan Type |
|---|---|---|---|
| Open | $1,700,000 | New Conventional | |
| Previous Owner | $1,060,000 | Purchase Money Mortgage |
| Date | Event | Price | List to Sale | Price per Sq Ft |
|---|---|---|---|---|
| 10/31/2025 10/31/25 | Sold | $3,400,000 | -4.2% | $2,350 / Sq Ft |
| 10/01/2025 10/01/25 | Pending | -- | -- | -- |
| 09/15/2025 09/15/25 | For Sale | $3,549,000 | -- | $2,453 / Sq Ft |
| Year | Tax Paid | Tax Assessment Tax Assessment Total Assessment is a certain percentage of the fair market value that is determined by local assessors to be the total taxable value of land and additions on the property. | Land | Improvement |
|---|---|---|---|---|
| 2025 | $25,149 | $2,426,251 | $1,924,270 | $501,981 |
| 2024 | $25,149 | $2,378,678 | $1,886,539 | $492,139 |
| 2023 | $24,870 | $2,332,038 | $1,849,548 | $482,490 |
| 2022 | $25,405 | $2,286,312 | $1,813,282 | $473,030 |
| 2021 | $25,880 | $2,241,483 | $1,777,728 | $463,755 |
| 2020 | $25,552 | $2,218,500 | $1,759,500 | $459,000 |
| 2019 | $25,186 | $2,175,000 | $1,725,000 | $450,000 |
| 2018 | $23,440 | $2,022,717 | $1,908,622 | $114,095 |
| 2017 | $23,013 | $1,983,056 | $1,871,198 | $111,858 |
| 2016 | $22,983 | $1,944,173 | $1,834,508 | $109,665 |
| 2015 | $22,125 | $1,914,970 | $1,806,952 | $108,018 |
| 2014 | -- | $1,877,459 | $1,771,556 | $105,903 |
Seller's Agent in 2025
Shauna Covington
Berkshire Hathaway HomeServices California Properties
(949) 412-8088
14 in this area
91 Total Sales
Seller Co-Listing Agent in 2025
Leita Covington
Berkshire Hathaway HomeServices California Properties
(949) 395-3037
6 in this area
35 Total Sales
Buyer's Agent in 2025
Trent Mason
DOUGLAS ELLIMAN OF CALIFORNIA, INC.
(949) 322-6977
2 in this area
98 Total Sales
Source: California Regional Multiple Listing Service (CRMLS)
MLS Number: LG25217884
APN: 496-171-26
Disclaimer: Certain information contained herein is derived from information provided by parties other than Homes.com. All information provided is deemed reliable, but is not guaranteed to be accurate and should be independently verified.
![]() The multiple listing data appearing on this website, or contained in reports produced therefrom, is owned and copyrighted by California Regional Multiple Listing Service, Inc. ("CRMLS") and is protected by all applicable copyright laws. Information provided is for viewer's personal, non-commercial use and may not be used for any purpose other than to identify prospective properties the viewer may be interested in purchasing. All listing data, including but not limited to square footage and lot size is believed to be accurate, but the listing Agent, listing Broker and CRMLS and its affiliates do not warrant or guarantee such accuracy. The viewer should independently verify the listed data prior to making any decisions based on such information by personal inspection and/or contacting a real estate professional.
The multiple listing data appearing on this website, or contained in reports produced therefrom, is owned and copyrighted by California Regional Multiple Listing Service, Inc. ("CRMLS") and is protected by all applicable copyright laws. Information provided is for viewer's personal, non-commercial use and may not be used for any purpose other than to identify prospective properties the viewer may be interested in purchasing. All listing data, including but not limited to square footage and lot size is believed to be accurate, but the listing Agent, listing Broker and CRMLS and its affiliates do not warrant or guarantee such accuracy. The viewer should independently verify the listed data prior to making any decisions based on such information by personal inspection and/or contacting a real estate professional.
Based on information from California Regional Multiple Listing Service, Inc. and /or other sources. All data, including all measurements and calculations of area, is obtained from various sources and has not been, and will not be, verified by broker or MLS. All information should be independently reviewed and verified for accuracy. Properties may or may not be listed by the office/agent presenting the information
Ask me questions while you tour the home.