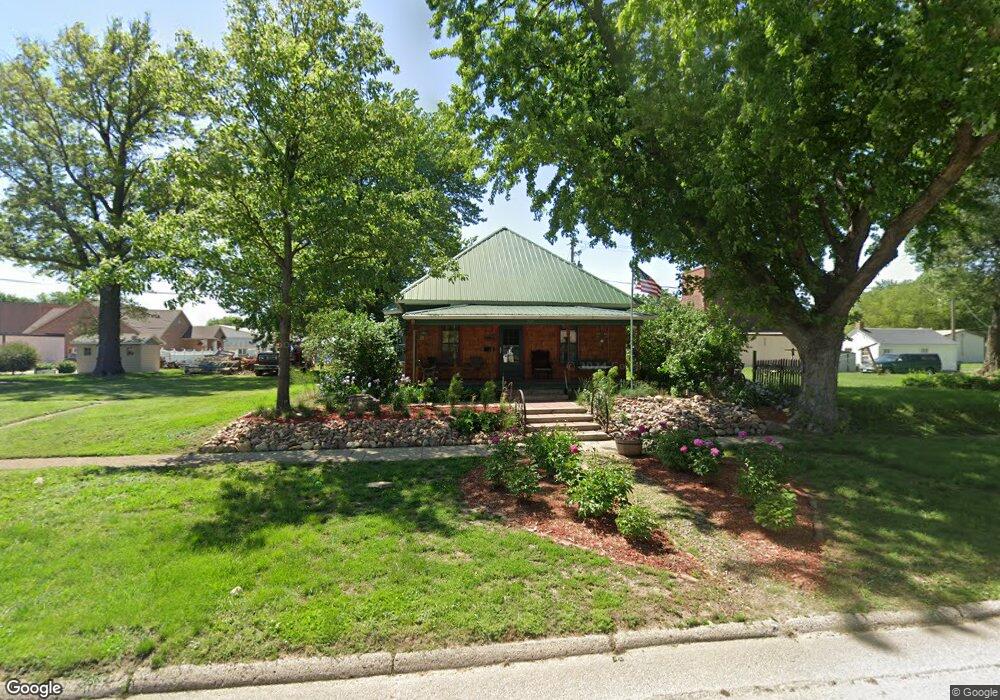
205 Liston St Danbury, IA 51019
Estimated Value: $83,000 - $97,530
2
Beds
1
Bath
1,156
Sq Ft
$79/Sq Ft
Est. Value
About This Home
This home is located at 205 Liston St, Danbury, IA 51019 and is currently estimated at $91,883, approximately $79 per square foot. 205 Liston St is a home located in Woodbury County with nearby schools including Mapleton Elementary School, Mvao Middle School, and Maple Valley-Anthon Oto High School.
Ownership History
Date
Name
Owned For
Owner Type
Purchase Details
Closed on
Aug 8, 2024
Sold by
Flynn Mary Lu
Bought by
Bell Parker S and Baker Kara Ann
Current Estimated Value
Home Financials for this Owner
Home Financials are based on the most recent Mortgage that was taken out on this home.
Original Mortgage
$4,750
Outstanding Balance
$4,695
Interest Rate
6.77%
Estimated Equity
$87,188
Purchase Details
Closed on
Mar 20, 2020
Sold by
Geyer Jennifer Jo and Geyer John F
Bought by
Flynn Mary Lu
Purchase Details
Closed on
Jan 17, 2019
Sold by
Flynn Mary L
Bought by
Geyer Jennifr J
Create a Home Valuation Report for This Property
The Home Valuation Report is an in-depth analysis detailing your home's value as well as a comparison with similar homes in the area
Home Values in the Area
Average Home Value in this Area
Purchase History
| Date | Buyer | Sale Price | Title Company |
|---|---|---|---|
| Bell Parker S | $95,000 | None Listed On Document | |
| Flynn Mary Lu | -- | None Available | |
| Geyer Jennifr J | -- | -- |
Source: Public Records
Mortgage History
| Date | Status | Borrower | Loan Amount |
|---|---|---|---|
| Open | Bell Parker S | $4,750 | |
| Open | Bell Parker S | $92,150 |
Source: Public Records
Tax History Compared to Growth
Tax History
| Year | Tax Paid | Tax Assessment Tax Assessment Total Assessment is a certain percentage of the fair market value that is determined by local assessors to be the total taxable value of land and additions on the property. | Land | Improvement |
|---|---|---|---|---|
| 2025 | $404 | $67,140 | $5,060 | $62,080 |
| 2024 | $404 | $48,670 | $5,060 | $43,610 |
| 2023 | $468 | $48,670 | $5,060 | $43,610 |
| 2022 | $434 | $43,430 | $5,060 | $38,370 |
| 2021 | $434 | $43,430 | $5,060 | $38,370 |
| 2020 | $178 | $23,830 | $5,410 | $18,420 |
| 2019 | $186 | $23,830 | $5,410 | $18,420 |
| 2018 | $178 | $23,830 | $5,410 | $18,420 |
| 2017 | $186 | $23,830 | $5,410 | $18,420 |
| 2016 | $182 | $23,830 | $0 | $0 |
| 2015 | $293 | $22,270 | $5,060 | $17,210 |
| 2014 | $158 | $22,270 | $5,060 | $17,210 |
Source: Public Records
Map
Nearby Homes