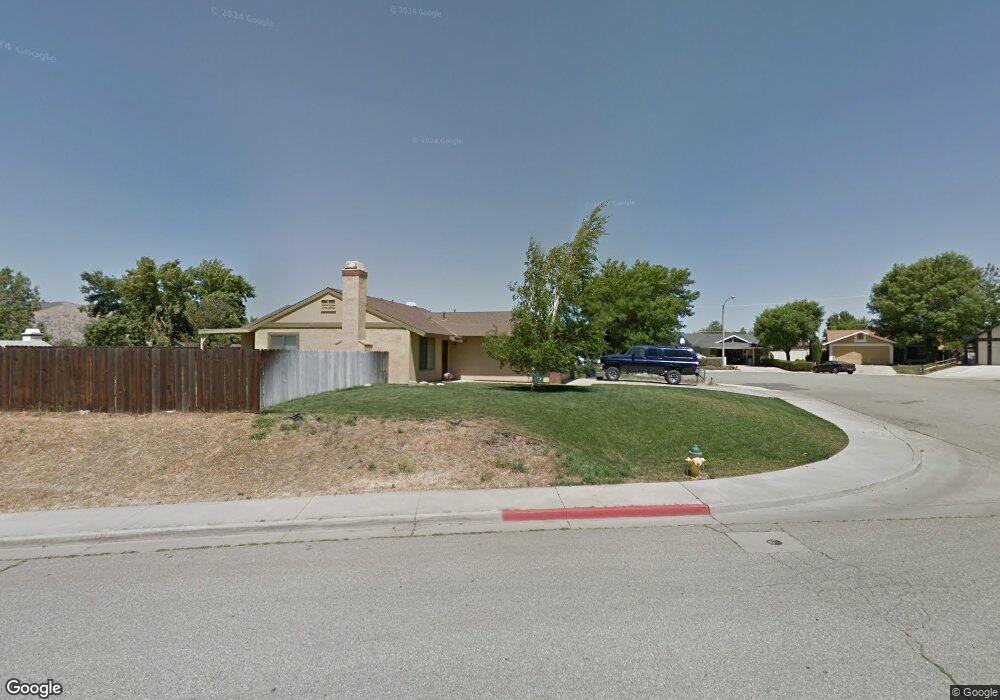
205 Peach Tree Ct Tehachapi, CA 93561
Estimated Value: $300,000 - $329,000
3
Beds
2
Baths
1,032
Sq Ft
$303/Sq Ft
Est. Value
About This Home
This home is located at 205 Peach Tree Ct, Tehachapi, CA 93561 and is currently estimated at $312,883, approximately $303 per square foot. 205 Peach Tree Ct is a home located in Kern County with nearby schools including Tompkins Elementary School, Jacobsen Middle School, and Tehachapi High School.
Ownership History
Date
Name
Owned For
Owner Type
Purchase Details
Closed on
Dec 21, 2009
Sold by
Us Bank National Association
Bought by
Doue Bret
Current Estimated Value
Home Financials for this Owner
Home Financials are based on the most recent Mortgage that was taken out on this home.
Original Mortgage
$112,244
Interest Rate
5%
Mortgage Type
New Conventional
Purchase Details
Closed on
Oct 8, 2009
Sold by
Larizadeh M R
Bought by
Us Bank National Association and Lxs 2005-9N Trust Fund
Purchase Details
Closed on
Sep 2, 2005
Sold by
Larizadeh Dianne
Bought by
Larizadeh M R
Home Financials for this Owner
Home Financials are based on the most recent Mortgage that was taken out on this home.
Original Mortgage
$160,000
Interest Rate
1.37%
Mortgage Type
Negative Amortization
Purchase Details
Closed on
Jul 18, 2005
Sold by
Singh Bal Mohan and Kaur Roop
Bought by
Larizadeh M R
Home Financials for this Owner
Home Financials are based on the most recent Mortgage that was taken out on this home.
Original Mortgage
$160,000
Interest Rate
1.37%
Mortgage Type
Negative Amortization
Purchase Details
Closed on
Jun 18, 2004
Sold by
Singh Bal Mohan
Bought by
Singh Bal Mohan and Kaur Roop
Purchase Details
Closed on
Mar 25, 2004
Sold by
Kaur Roop
Bought by
Singh Bal Mohan
Home Financials for this Owner
Home Financials are based on the most recent Mortgage that was taken out on this home.
Original Mortgage
$125,875
Interest Rate
5.38%
Mortgage Type
Purchase Money Mortgage
Purchase Details
Closed on
Mar 22, 2004
Sold by
Mcconnell Phillip and Mcconnell Deborah
Bought by
Singh Bal Mohan
Home Financials for this Owner
Home Financials are based on the most recent Mortgage that was taken out on this home.
Original Mortgage
$125,875
Interest Rate
5.38%
Mortgage Type
Purchase Money Mortgage
Purchase Details
Closed on
Mar 5, 1999
Sold by
Tauriello Anthony and Tauriello Heather
Bought by
Mcconnell Phillip and Mcconnell Deborah
Home Financials for this Owner
Home Financials are based on the most recent Mortgage that was taken out on this home.
Original Mortgage
$71,650
Interest Rate
6.91%
Purchase Details
Closed on
Mar 26, 1997
Sold by
Va
Bought by
Tauriello Anthony
Home Financials for this Owner
Home Financials are based on the most recent Mortgage that was taken out on this home.
Original Mortgage
$54,150
Interest Rate
7.86%
Purchase Details
Closed on
Dec 11, 1996
Sold by
Homeside Lending Inc
Bought by
Va
Create a Home Valuation Report for This Property
The Home Valuation Report is an in-depth analysis detailing your home's value as well as a comparison with similar homes in the area
Home Values in the Area
Average Home Value in this Area
Purchase History
| Date | Buyer | Sale Price | Title Company |
|---|---|---|---|
| Doue Bret | $110,000 | Chicago Title Insurance Co | |
| Us Bank National Association | $107,098 | Accommodation | |
| Larizadeh M R | -- | Alliance Title | |
| Larizadeh M R | $200,000 | Alliance Title | |
| Singh Bal Mohan | -- | -- | |
| Singh Bal Mohan | -- | Chicago Title | |
| Singh Bal Mohan | $132,500 | Chicago Title | |
| Mcconnell Phillip | $67,500 | -- | |
| Tauriello Anthony | $60,500 | First American Title Co | |
| Va | -- | Fidelity National Title | |
| Homeside Lending Inc | $54,330 | Fidelity National Title |
Source: Public Records
Mortgage History
| Date | Status | Borrower | Loan Amount |
|---|---|---|---|
| Previous Owner | Doue Bret | $112,244 | |
| Previous Owner | Larizadeh M R | $160,000 | |
| Previous Owner | Singh Bal Mohan | $125,875 | |
| Previous Owner | Mcconnell Phillip | $71,650 | |
| Previous Owner | Tauriello Anthony | $54,150 |
Source: Public Records
Tax History
| Year | Tax Paid | Tax Assessment Tax Assessment Total Assessment is a certain percentage of the fair market value that is determined by local assessors to be the total taxable value of land and additions on the property. | Land | Improvement |
|---|---|---|---|---|
| 2025 | $1,797 | $141,977 | $38,717 | $103,260 |
| 2024 | $1,731 | $139,194 | $37,958 | $101,236 |
| 2023 | $1,731 | $136,465 | $37,214 | $99,251 |
| 2022 | $1,710 | $133,790 | $36,485 | $97,305 |
| 2021 | $1,666 | $131,168 | $35,770 | $95,398 |
| 2020 | $1,661 | $129,824 | $35,404 | $94,420 |
| 2019 | $1,661 | $129,824 | $35,404 | $94,420 |
| 2018 | $1,604 | $124,784 | $34,030 | $90,754 |
| 2017 | $1,602 | $122,338 | $33,363 | $88,975 |
| 2016 | $1,560 | $119,940 | $32,709 | $87,231 |
| 2015 | $1,486 | $118,139 | $32,218 | $85,921 |
| 2014 | $1,470 | $115,825 | $31,587 | $84,238 |
Source: Public Records
Map
Nearby Homes
- 1360 Bodega Dr
- 23860 El Rancho Dr
- 1320 El Rancho Dr
- 114 Chaparrel St
- 1331 S Green St
- 1309 Clasico Dr
- 0 Pinon St
- 210 Pinon St Unit 11
- 210 Pinon St Unit 18
- 210 Pinon St Unit 4
- 210 Pinon St Unit 1
- 210 Pinon St Unit 6
- 210 Pinon St Unit 15
- 210 Pinon St Unit 5
- 210 Pinon St Unit 9
- 210 Pinon St Unit 7
- 210 Pinon St Unit 13
- 210 Pinon St Unit 8
- 210 Pinon St Unit 3
- 210 Pinon St Unit 16
- 203 Peach Tree Ct
- 204 Chestnut Ct
- 202 Chestnut Ct
- 200 Peach Tree Ct
- 209 Peach Tree Ct
- 202 Peach Tree Ct
- 208 Chestnut Ct
- 200 Chestnut Ct
- 191 Chestnut Ct
- 204 Peach Tree Ct
- 210 Chestnut Ct
- 206 Peach Tree Ct
- 208 Peach Tree Ct
- 0 Chestnut Ct
- 203 Chestnut Ct
- 207 Chestnut Ct
- 205 Chestnut Ct
- 1333 Alder Ave
- 1331 Tanglewood Dr Unit B
- 209 Chestnut Ct
Your Personal Tour Guide
Ask me questions while you tour the home.