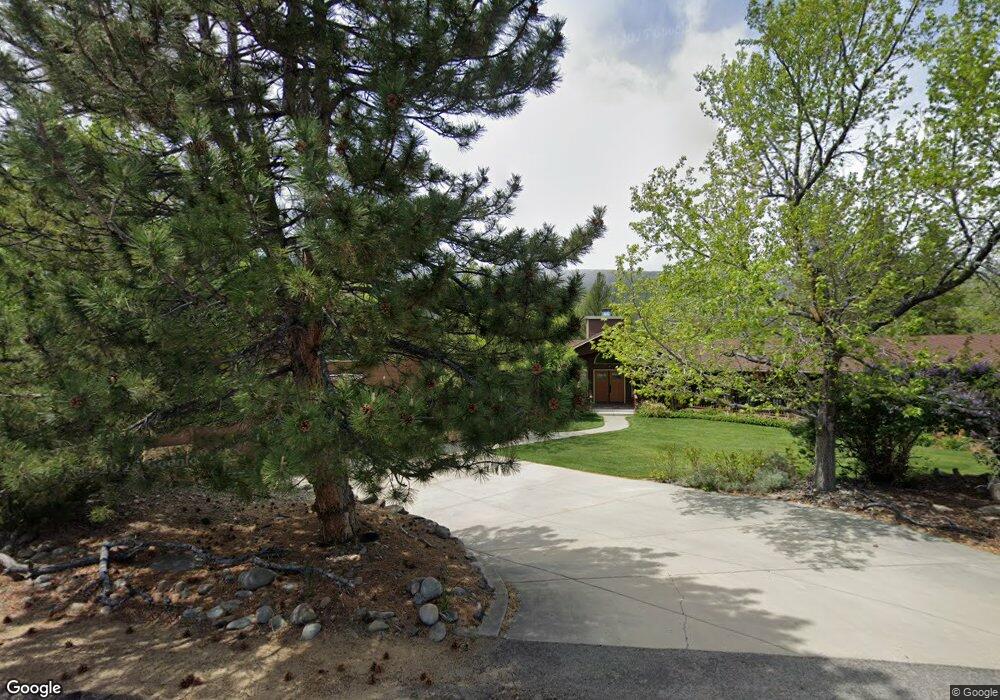
205 Prickly Pear Rd Verdi, NV 89439
Belli Ranch NeighborhoodEstimated Value: $1,079,000 - $1,879,000
4
Beds
4
Baths
4,463
Sq Ft
$329/Sq Ft
Est. Value
About This Home
This home is located at 205 Prickly Pear Rd, Verdi, NV 89439 and is currently estimated at $1,467,157, approximately $328 per square foot. 205 Prickly Pear Rd is a home with nearby schools including Verdi Elementary School, B D Billinghurst Middle School, and Robert McQueen High School.
Ownership History
Date
Name
Owned For
Owner Type
Purchase Details
Closed on
Jun 25, 2014
Sold by
Cole Robert S
Bought by
The Cole Family Trust
Current Estimated Value
Purchase Details
Closed on
Jun 6, 2002
Sold by
Kohn Cole Beth L and Cole Robert S
Bought by
Kohn Cole Beth L and Cole Robert S
Home Financials for this Owner
Home Financials are based on the most recent Mortgage that was taken out on this home.
Original Mortgage
$125,000
Interest Rate
6.83%
Mortgage Type
Purchase Money Mortgage
Purchase Details
Closed on
Jun 4, 2002
Sold by
Depaoli Gordon H
Bought by
Cole Robert S and Kohn Cole Beth L
Home Financials for this Owner
Home Financials are based on the most recent Mortgage that was taken out on this home.
Original Mortgage
$125,000
Interest Rate
6.83%
Mortgage Type
Purchase Money Mortgage
Purchase Details
Closed on
Jul 13, 1995
Sold by
Knudtsen William C
Bought by
Knudtsen Molly F
Purchase Details
Closed on
Jul 10, 1995
Sold by
Boulet Ken and Boulet Karen
Bought by
Knudtsen Molly F
Create a Home Valuation Report for This Property
The Home Valuation Report is an in-depth analysis detailing your home's value as well as a comparison with similar homes in the area
Home Values in the Area
Average Home Value in this Area
Purchase History
| Date | Buyer | Sale Price | Title Company |
|---|---|---|---|
| The Cole Family Trust | -- | None Available | |
| Kohn Cole Beth L | $425,000 | Western Title Inc | |
| Cole Robert S | $425,000 | Western Title Inc | |
| Knudtsen Molly F | -- | Stewart Title | |
| Knudtsen Molly F | -- | Stewart Title |
Source: Public Records
Mortgage History
| Date | Status | Borrower | Loan Amount |
|---|---|---|---|
| Closed | Cole Robert S | $125,000 |
Source: Public Records
Tax History Compared to Growth
Tax History
| Year | Tax Paid | Tax Assessment Tax Assessment Total Assessment is a certain percentage of the fair market value that is determined by local assessors to be the total taxable value of land and additions on the property. | Land | Improvement |
|---|---|---|---|---|
| 2025 | $6,225 | $263,215 | $88,550 | $174,665 |
| 2024 | $6,225 | $266,200 | $88,550 | $177,650 |
| 2023 | $6,044 | $254,125 | $84,700 | $169,425 |
| 2022 | $5,868 | $219,035 | $77,000 | $142,035 |
| 2021 | $5,697 | $213,445 | $71,225 | $142,220 |
| 2020 | $5,530 | $212,649 | $69,300 | $143,349 |
| 2019 | $5,369 | $198,831 | $57,750 | $141,081 |
| 2018 | $5,212 | $184,913 | $46,200 | $138,713 |
| 2017 | $5,061 | $175,554 | $35,805 | $139,749 |
| 2016 | $4,782 | $165,265 | $34,650 | $130,615 |
| 2015 | $1,193 | $147,269 | $21,070 | $126,199 |
| 2014 | $4,638 | $143,142 | $21,070 | $122,072 |
| 2013 | -- | $140,966 | $21,070 | $119,896 |
Source: Public Records
Map
Nearby Homes
- 263 Commodore Dr Unit LOT 302/Model 1
- Woodshire Plan at Quilici - Treeside Collection
- Timberly Elite Plan at Quilici - Treeside Collection
- Timberly Plan at Quilici - Treeside Collection
- Aspyn Plan at Quilici - Treeside Collection
- 405 River Pines Dr
- 171 Commodore Dr Unit Lot 325
- 549 S Verdi Rd
- 509 Mercator Ct Unit Lot 339
- 505 Mercator Ct Unit Lot 340
- 551 Mercator Unit Homesite 330
- 159 Starboard Dr Unit Lot 342
- 178 Commodore Dr Unit Lot 373
- 182 Commodore Dr Unit Lot 374
- 207 Commodore Dr
- 557 Mercator Cir
- 660 Dog Valley Rd
- 203 Starboard Dr Unit LOT 353
- 355 River Pines Dr
- 421 River Pines Dr
- 200 Hansen Dr
- 175 Prickly Pear Rd
- 245 Prickly Pear Rd
- 220 Hansen Dr
- 180 Hansen Dr
- 196 Circle Place
- 170 Not Supplied Rd
- 252 Prickly Pear Rd
- 240 Hansen Dr
- 145 Prickly Pear Rd
- 160 Hansen Dr
- 225 Hansen Dr
- 195 Hansen Dr
- 175 Hansen Dr
- 265 Prickly Pear Rd
- 160 Prickly Pear Rd
- 180 Circle Place
- 105 Prickly Pear Rd
- 190 Circle Place
- 202 Commodore Dr