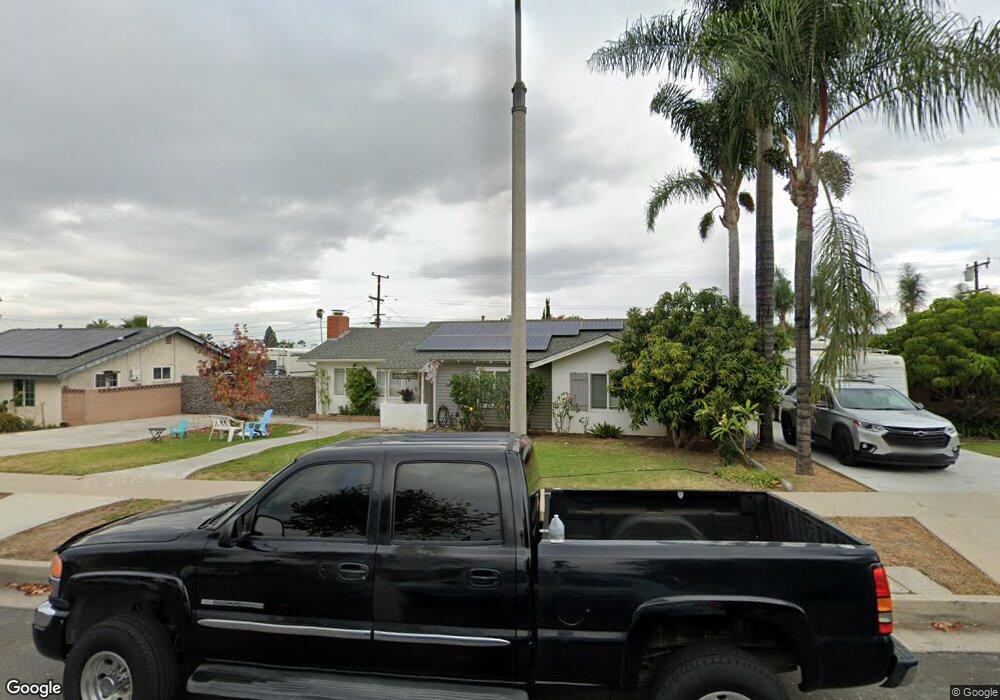
205 W Hacienda Dr Corona, CA 92882
Central Corona NeighborhoodEstimated Value: $631,000 - $720,000
3
Beds
2
Baths
1,190
Sq Ft
$563/Sq Ft
Est. Value
About This Home
This home is located at 205 W Hacienda Dr, Corona, CA 92882 and is currently estimated at $670,342, approximately $563 per square foot. 205 W Hacienda Dr is a home located in Riverside County with nearby schools including Vicentia Elementary School, Letha Raney Intermediate School, and Corona High School.
Ownership History
Date
Name
Owned For
Owner Type
Purchase Details
Closed on
Jan 11, 2002
Sold by
Tooth George R and Tooth Pamela J
Bought by
Tooth George R and Tooth Pamela J
Current Estimated Value
Home Financials for this Owner
Home Financials are based on the most recent Mortgage that was taken out on this home.
Original Mortgage
$23,000
Outstanding Balance
$9,446
Interest Rate
7.11%
Mortgage Type
Credit Line Revolving
Estimated Equity
$660,896
Purchase Details
Closed on
Jul 26, 1999
Sold by
Hud
Bought by
Tooth George R and Tooth Pamela J
Home Financials for this Owner
Home Financials are based on the most recent Mortgage that was taken out on this home.
Original Mortgage
$102,174
Outstanding Balance
$33,609
Interest Rate
9.5%
Estimated Equity
$636,733
Purchase Details
Closed on
Feb 9, 1999
Sold by
Chase Mtg Services Inc
Bought by
Hud
Purchase Details
Closed on
May 20, 1998
Sold by
Clough Craig L and Clough Penelope D
Bought by
Chase Mtg Services Inc and Chase Manhattan Mtg Corp
Create a Home Valuation Report for This Property
The Home Valuation Report is an in-depth analysis detailing your home's value as well as a comparison with similar homes in the area
Home Values in the Area
Average Home Value in this Area
Purchase History
| Date | Buyer | Sale Price | Title Company |
|---|---|---|---|
| Tooth George R | -- | First American Title Ins Co | |
| Tooth George R | $120,500 | American Title | |
| Hud | -- | Landsafe Title | |
| Chase Mtg Services Inc | $94,867 | Landsafe Title |
Source: Public Records
Mortgage History
| Date | Status | Borrower | Loan Amount |
|---|---|---|---|
| Open | Tooth George R | $23,000 | |
| Open | Tooth George R | $102,174 |
Source: Public Records
Tax History Compared to Growth
Tax History
| Year | Tax Paid | Tax Assessment Tax Assessment Total Assessment is a certain percentage of the fair market value that is determined by local assessors to be the total taxable value of land and additions on the property. | Land | Improvement |
|---|---|---|---|---|
| 2025 | $1,992 | $184,402 | $84,514 | $99,888 |
| 2023 | $1,992 | $177,243 | $81,233 | $96,010 |
| 2022 | $1,927 | $173,769 | $79,641 | $94,128 |
| 2021 | $1,887 | $170,363 | $78,080 | $92,283 |
| 2020 | $1,866 | $168,617 | $77,280 | $91,337 |
| 2019 | $1,822 | $165,312 | $75,765 | $89,547 |
| 2018 | $1,781 | $162,072 | $74,281 | $87,791 |
| 2017 | $1,737 | $158,895 | $72,825 | $86,070 |
| 2016 | $1,719 | $155,781 | $71,398 | $84,383 |
| 2015 | $1,681 | $153,443 | $70,327 | $83,116 |
| 2014 | $1,620 | $150,439 | $68,950 | $81,489 |
Source: Public Records
Map
Nearby Homes
- 1650 S Belle Ave
- 256 E Mission Rd
- 1508 S Main St
- 1644 Taylor Ave
- 395 E Monterey Rd
- 389 E Rancho Rd
- 397 Raymor Ave
- 1710 Garretson Ave
- 1643 Melody Cir
- 2102 Beatrice Dr
- 853 W Crestview St
- 637 Greengate St
- 1116 W Grand Blvd
- 2495 Hannum Cir
- 2491 Picasso Cir
- 687 Locust St
- 920 Burr St
- 2476 Grove Ave
- 431 Redwing Dr
- 1991 Wren Ave
- 127 W Hacienda Dr
- 211 W Hacienda Dr
- 204 W Old Mill Rd
- 210 W Old Mill Rd
- 126 W Old Mill Rd
- 121 W Hacienda Dr
- 217 W Hacienda Dr
- 204 W Hacienda Dr
- 126 W Hacienda Dr
- 216 W Old Mill Rd
- 120 W Old Mill Rd
- 210 W Hacienda Dr
- 223 W Hacienda Dr
- 115 W Hacienda Dr
- 216 W Hacienda Dr
- 222 W Old Mill Rd
- 114 W Old Mill Rd
- 205 W Old Mill Rd
- 1911 Davis St
- 220 W Mission Ct