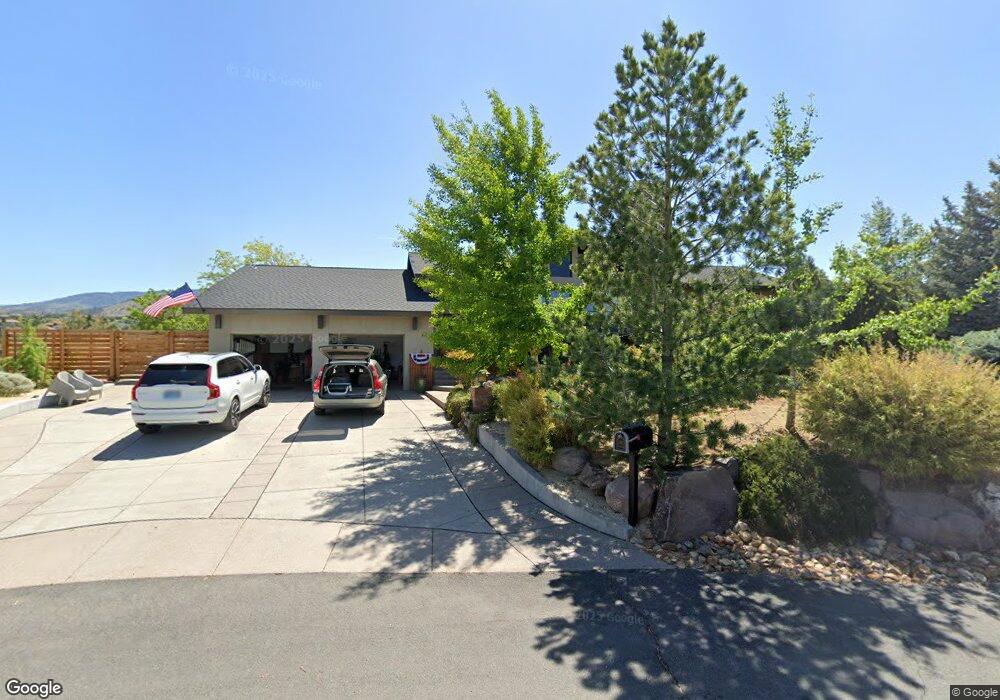
2050 Scharr Cir Reno, NV 89509
West Plumb-Cashill Boulevard NeighborhoodEstimated Value: $766,000 - $1,377,000
5
Beds
4
Baths
3,950
Sq Ft
$244/Sq Ft
Est. Value
About This Home
This home is located at 2050 Scharr Cir, Reno, NV 89509 and is currently estimated at $963,455, approximately $243 per square foot. 2050 Scharr Cir is a home located in Washoe County with nearby schools including Roy Gomm Elementary School, Darrell C Swope Middle School, and Reno High School.
Ownership History
Date
Name
Owned For
Owner Type
Purchase Details
Closed on
May 28, 2010
Sold by
Westermeyer John A and Westermeyer Carolyn J
Bought by
Westermeyer John and Westermeyer Carolyn
Current Estimated Value
Purchase Details
Closed on
Apr 15, 2009
Sold by
Ford Charles T
Bought by
Westermeyer John A and Westermeyer Carolyn J
Home Financials for this Owner
Home Financials are based on the most recent Mortgage that was taken out on this home.
Original Mortgage
$405,600
Outstanding Balance
$257,092
Interest Rate
4.99%
Mortgage Type
Unknown
Estimated Equity
$706,363
Purchase Details
Closed on
Jan 16, 2009
Sold by
Lenfestey Amy L
Bought by
Ford Charles T
Purchase Details
Closed on
Dec 6, 2007
Sold by
Stewart D Roger
Bought by
Lenfestey Amy L and Ford Charles T
Create a Home Valuation Report for This Property
The Home Valuation Report is an in-depth analysis detailing your home's value as well as a comparison with similar homes in the area
Home Values in the Area
Average Home Value in this Area
Purchase History
| Date | Buyer | Sale Price | Title Company |
|---|---|---|---|
| Westermeyer John | -- | None Available | |
| Westermeyer John A | $507,000 | Ticor Title Reno | |
| Ford Charles T | -- | First Centennial Reno | |
| Lenfestey Amy L | $525,000 | First Centennial Title Co |
Source: Public Records
Mortgage History
| Date | Status | Borrower | Loan Amount |
|---|---|---|---|
| Open | Westermeyer John A | $405,600 |
Source: Public Records
Tax History Compared to Growth
Tax History
| Year | Tax Paid | Tax Assessment Tax Assessment Total Assessment is a certain percentage of the fair market value that is determined by local assessors to be the total taxable value of land and additions on the property. | Land | Improvement |
|---|---|---|---|---|
| 2025 | $2,497 | $115,991 | $65,648 | $50,343 |
| 2024 | $2,497 | $113,572 | $63,756 | $49,816 |
| 2023 | $2,427 | $109,710 | $63,756 | $45,954 |
| 2022 | $2,362 | $88,931 | $51,279 | $37,653 |
| 2021 | $2,296 | $82,921 | $46,200 | $36,721 |
| 2020 | $2,227 | $82,277 | $46,200 | $36,077 |
| 2019 | $2,161 | $76,987 | $42,000 | $34,987 |
| 2018 | $2,099 | $70,158 | $36,540 | $33,618 |
| 2017 | $2,037 | $69,639 | $36,540 | $33,099 |
| 2016 | $1,985 | $63,362 | $30,492 | $32,870 |
| 2015 | $1,490 | $59,781 | $27,160 | $32,621 |
| 2014 | $1,925 | $55,390 | $22,365 | $33,025 |
| 2013 | -- | $53,264 | $19,740 | $33,524 |
Source: Public Records
Map
Nearby Homes
- 2085 La Fond Dr
- 2095 La Fond Dr
- 3100 Susileen Dr
- 2345 Camelot Way
- 2891 Sagittarius Dr
- 3495 W Plumb Ln
- 1755 Benjamin Franklin Dr
- 0 Meridian Ln Unit 250054401
- 2915 Susileen Dr
- 3355 Markridge Dr
- 2905 Susileen Dr
- 3280 Thornhill Dr
- 0 Markridge Dr Unit 230002663
- 3265 Markridge Dr
- 000 Markridge Dr
- 2315 Armstrong Ln
- 3475 Meridian Ln
- 2240 W Plumb Ln
- 0 Marthiam Ave
- 3390 Thornhill Dr
- 2049 Scharr Cir
- 2060 La Fond Dr
- 2065 La Fond Dr
- 2055 La Fond Dr
- 2048 Scharr Cir
- 2044 Scharr Cir
- 2045 La Fond Dr
- 2070 La Fond Dr
- 2030 La Fond Dr
- 2075 La Fond Dr
- 2046 Scharr Cir
- 2180 Driscoll Dr
- 2070 Driscoll Dr
- 2060 Driscoll Dr
- 2080 Driscoll Dr
- 2050 Driscoll Dr
- 2085 La Fond Dr Unit 15
- 2080 La Fond Dr
- 2140 Driscoll Dr
- 2040 Driscoll Dr