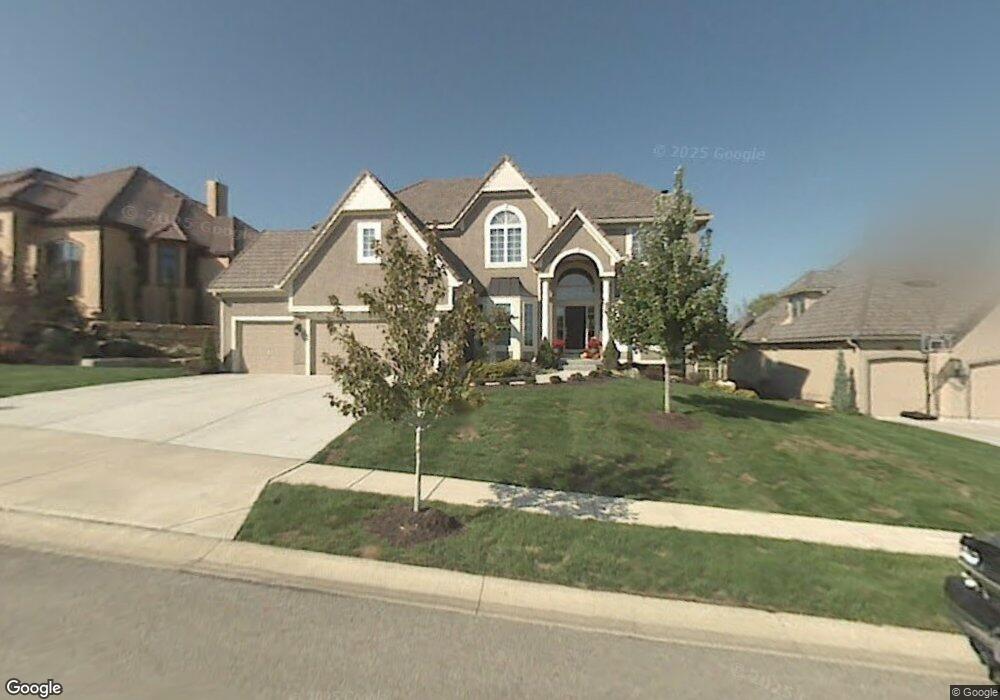
20500 W 88th Terrace Lenexa, KS 66220
Estimated Value: $748,766 - $834,000
4
Beds
4
Baths
3,476
Sq Ft
$226/Sq Ft
Est. Value
About This Home
This home is located at 20500 W 88th Terrace, Lenexa, KS 66220 and is currently estimated at $784,942, approximately $225 per square foot. 20500 W 88th Terrace is a home located in Johnson County with nearby schools including Manchester Park Elementary School, Prairie Trail Middle School, and Olathe Northwest High School.
Ownership History
Date
Name
Owned For
Owner Type
Purchase Details
Closed on
Jan 19, 2005
Sold by
Lamble Geer Homes Inc
Bought by
Messenger Jeff C and Messenger Heather A
Current Estimated Value
Home Financials for this Owner
Home Financials are based on the most recent Mortgage that was taken out on this home.
Original Mortgage
$250,000
Outstanding Balance
$125,636
Interest Rate
5.68%
Mortgage Type
New Conventional
Estimated Equity
$659,306
Purchase Details
Closed on
Jun 11, 2004
Sold by
Julian Morrissey Horn Development Co Llc
Bought by
Lambie Geer Homes Inc
Home Financials for this Owner
Home Financials are based on the most recent Mortgage that was taken out on this home.
Original Mortgage
$315,000
Interest Rate
6.02%
Mortgage Type
Purchase Money Mortgage
Create a Home Valuation Report for This Property
The Home Valuation Report is an in-depth analysis detailing your home's value as well as a comparison with similar homes in the area
Home Values in the Area
Average Home Value in this Area
Purchase History
| Date | Buyer | Sale Price | Title Company |
|---|---|---|---|
| Messenger Jeff C | -- | Guarantee Title | |
| Lambie Geer Homes Inc | -- | Security Land Title Company |
Source: Public Records
Mortgage History
| Date | Status | Borrower | Loan Amount |
|---|---|---|---|
| Open | Messenger Jeff C | $250,000 | |
| Previous Owner | Lambie Geer Homes Inc | $315,000 |
Source: Public Records
Tax History Compared to Growth
Tax History
| Year | Tax Paid | Tax Assessment Tax Assessment Total Assessment is a certain percentage of the fair market value that is determined by local assessors to be the total taxable value of land and additions on the property. | Land | Improvement |
|---|---|---|---|---|
| 2024 | $9,356 | $75,981 | $16,843 | $59,138 |
| 2023 | $9,509 | $75,992 | $16,843 | $59,149 |
| 2022 | $9,084 | $70,805 | $14,031 | $56,774 |
| 2021 | $8,022 | $59,570 | $14,031 | $45,539 |
| 2020 | $8,279 | $60,904 | $14,031 | $46,873 |
| 2019 | $8,061 | $58,857 | $12,756 | $46,101 |
| 2018 | $7,780 | $56,166 | $11,701 | $44,465 |
| 2017 | $7,881 | $55,683 | $11,701 | $43,982 |
| 2016 | $7,486 | $54,096 | $11,135 | $42,961 |
| 2015 | $7,355 | $53,164 | $11,135 | $42,029 |
| 2013 | -- | $47,874 | $11,135 | $36,739 |
Source: Public Records
Map
Nearby Homes
- 20415 W 88th Terrace
- 8709 Pine St
- 8823 Vista Dr
- 20413 Crickett Ln
- 21101 W 90th St
- 20308 W 92nd St
- 9238 Marion St
- 21359 W 93rd Ct
- 9268 Brownridge St
- 9259 Deer Run St
- 20825 W 94th Terrace
- 9517 Falcon Ridge Dr
- 9410 Deer Run St
- 0 W 95th St
- 9500 Woodland Rd
- 9450 Marion St
- 21111 W 95th Terrace
- 21123 W 95th Terrace
- 22068 W 94th Terrace
- 22105 W 94th Terrace
- 20506 W 88th Terrace
- 20416 W 88th Terrace
- 20501 W 88th Terrace
- 20421 W 88th Terrace
- 20410 W 88th Terrace
- 20507 W 88th Terrace
- 8833 Pine St
- 8839 Pine St
- 8827 Pine St
- 20513 W 88th Terrace
- 8821 Pine St
- 20404 W 88th Terrace
- 20407 W 88th Terrace
- 20417 W 88th St
- 20411 W 88th St
- 8815 Pine St
- 20403 W 88th Terrace
- 20519 W 88th Terrace
- 20405 W 88th St
- 20518 W 89th St