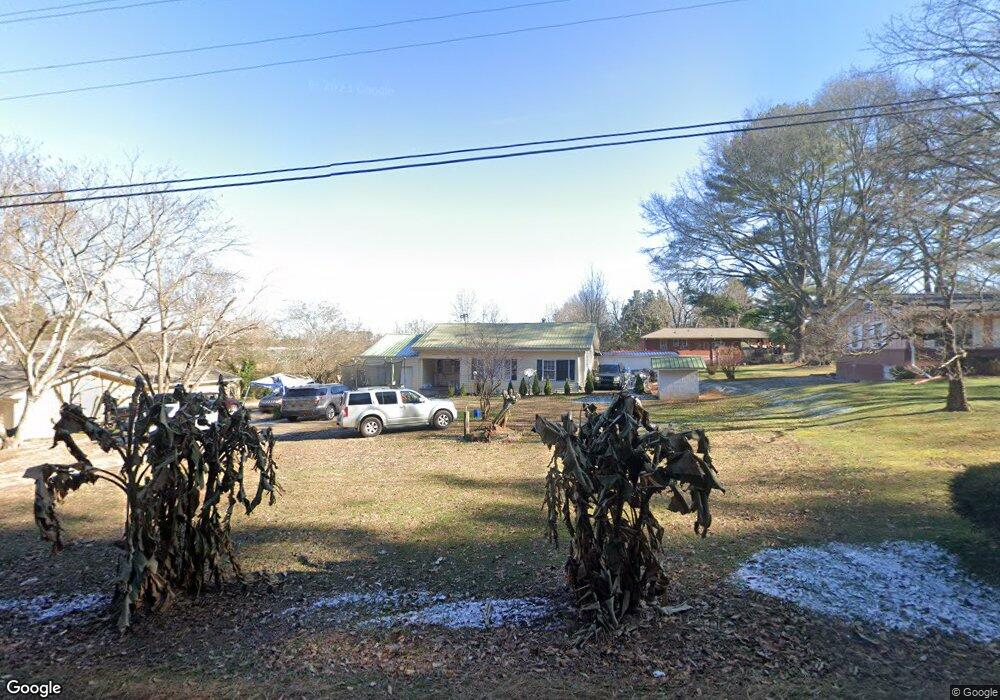
2051 Greencrest Dr Gainesville, GA 30504
Browns Bridge NeighborhoodEstimated Value: $187,000 - $233,000
3
Beds
1
Bath
908
Sq Ft
$234/Sq Ft
Est. Value
About This Home
This home is located at 2051 Greencrest Dr, Gainesville, GA 30504 and is currently estimated at $212,278, approximately $233 per square foot. 2051 Greencrest Dr is a home located in Hall County with nearby schools including McEver Elementary School, West Hall Middle School, and West Hall High School.
Ownership History
Date
Name
Owned For
Owner Type
Purchase Details
Closed on
Dec 7, 2017
Sold by
Corado Angel David
Bought by
Maldonado Salvador
Current Estimated Value
Home Financials for this Owner
Home Financials are based on the most recent Mortgage that was taken out on this home.
Original Mortgage
$15,000
Outstanding Balance
$12,556
Interest Rate
3.9%
Mortgage Type
New Conventional
Estimated Equity
$199,722
Purchase Details
Closed on
Jan 25, 2013
Sold by
Miller Steve M
Bought by
Walls Bobby Joe
Purchase Details
Closed on
Jan 24, 2013
Sold by
Miller Gary D
Bought by
Walls Bobby Joe
Create a Home Valuation Report for This Property
The Home Valuation Report is an in-depth analysis detailing your home's value as well as a comparison with similar homes in the area
Home Values in the Area
Average Home Value in this Area
Purchase History
| Date | Buyer | Sale Price | Title Company |
|---|---|---|---|
| Maldonado Salvador | $40,000 | -- | |
| Walls Bobby Joe | -- | -- | |
| Walls Bobby Joe | -- | -- | |
| Corado Angel David | $29,000 | -- | |
| Walls Bobby Joe | -- | -- |
Source: Public Records
Mortgage History
| Date | Status | Borrower | Loan Amount |
|---|---|---|---|
| Open | Maldonado Salvador | $15,000 |
Source: Public Records
Tax History Compared to Growth
Tax History
| Year | Tax Paid | Tax Assessment Tax Assessment Total Assessment is a certain percentage of the fair market value that is determined by local assessors to be the total taxable value of land and additions on the property. | Land | Improvement |
|---|---|---|---|---|
| 2025 | $1,405 | $55,840 | $19,200 | $36,640 |
| 2024 | $1,820 | $70,720 | $19,200 | $51,520 |
| 2023 | $1,415 | $54,320 | $5,640 | $48,680 |
| 2022 | $1,191 | $43,400 | $5,640 | $37,760 |
| 2021 | $1,120 | $39,880 | $5,680 | $34,200 |
| 2020 | $1,104 | $38,120 | $5,680 | $32,440 |
| 2019 | $942 | $31,840 | $5,680 | $26,160 |
| 2018 | $525 | $27,400 | $5,680 | $21,720 |
| 2017 | $826 | $26,954 | $5,680 | $21,274 |
| 2016 | $807 | $26,954 | $5,680 | $21,274 |
| 2015 | $393 | $26,954 | $5,680 | $21,274 |
| 2014 | $393 | $26,954 | $5,680 | $21,274 |
Source: Public Records
Map
Nearby Homes
- 0 Hilton Dr Unit 10529633
- 0 Hilton Dr Unit 7585721
- 4143 Millstone Ln
- 2054 Spring Rd
- 1122 Villa Clara Way
- 2244 Bennett Cir
- 2116 Memorial Park Dr
- 1636 Atlanta Hwy
- 3022 Waterford Dr
- 221 Shallowford Dr
- 6775 Browns Bridge Rd
- 593 Shallowford Rd NW
- 2905 Florence Dr
- #25 3022 Waterford Dr
- 2881 Florence Dr Unit 2881
- 2638 Waters Edge Dr
- 2826 Fox Wood Ln
- 2849 Florence Dr Unit 2849
- 2646 Waters Edge Dr
- 4809 Orchard Grove Way Unit 170
- 2045 Greencrest Dr
- 2061 Greencrest Dr
- 2102 Dixie Dr Unit 14
- 2102 Dixie Dr
- 2104 Dixie Dr
- 2100 Dixie Dr
- 2071 Greencrest Dr
- 2035 Greencrest Dr
- 2106 Dixie Dr
- 2081 Greencrest Dr
- 2012 Dixie Dr
- 2108 Dixie Dr
- 2100 Westhaven Dr
- 2025 Greencrest Dr
- 2091 Greencrest Dr
- 2107 Dixie Dr
- 2110 Dixie Dr
- 2105 Dixie Dr
- 2104 Westhaven Dr
- 2010 Dixie Dr