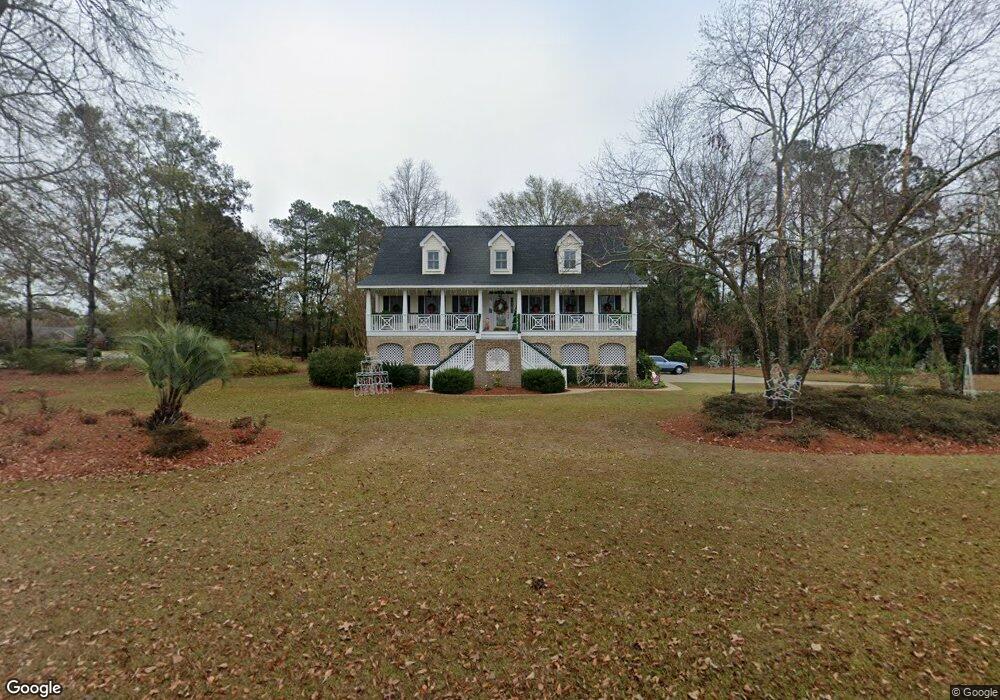
2051 W Lake Shore Dr Pinopolis, SC 29469
Estimated Value: $546,006 - $980,000
3
Beds
3
Baths
2,994
Sq Ft
$224/Sq Ft
Est. Value
About This Home
This home is located at 2051 W Lake Shore Dr, Pinopolis, SC 29469 and is currently estimated at $671,752, approximately $224 per square foot. 2051 W Lake Shore Dr is a home located in Berkeley County with nearby schools including Berkeley Elementary School, Berkeley Middle School, and Berkeley High School.
Ownership History
Date
Name
Owned For
Owner Type
Purchase Details
Closed on
Mar 2, 2022
Sold by
Walling Vickie M
Bought by
Walling James D and Walling Vickie M
Current Estimated Value
Purchase Details
Closed on
Sep 24, 2009
Sold by
Walling James D
Bought by
Walling Vickie M
Create a Home Valuation Report for This Property
The Home Valuation Report is an in-depth analysis detailing your home's value as well as a comparison with similar homes in the area
Home Values in the Area
Average Home Value in this Area
Purchase History
| Date | Buyer | Sale Price | Title Company |
|---|---|---|---|
| Walling James D | -- | None Listed On Document | |
| Walling Vickie M | -- | -- |
Source: Public Records
Tax History Compared to Growth
Tax History
| Year | Tax Paid | Tax Assessment Tax Assessment Total Assessment is a certain percentage of the fair market value that is determined by local assessors to be the total taxable value of land and additions on the property. | Land | Improvement |
|---|---|---|---|---|
| 2025 | $1,600 | $422,142 | $90,453 | $331,689 |
| 2024 | $1,600 | $16,886 | $3,618 | $13,268 |
| 2023 | $1,600 | $16,886 | $3,618 | $13,268 |
| 2022 | $1,577 | $22,024 | $4,569 | $17,455 |
| 2021 | $1,617 | $14,690 | $3,046 | $11,637 |
| 2020 | $1,637 | $14,683 | $3,046 | $11,637 |
| 2019 | $1,829 | $14,683 | $3,046 | $11,637 |
| 2018 | $1,674 | $12,768 | $3,600 | $9,168 |
| 2017 | $1,525 | $12,768 | $3,600 | $9,168 |
| 2016 | $1,564 | $12,770 | $3,600 | $9,170 |
| 2015 | $1,433 | $12,770 | $3,600 | $9,170 |
| 2014 | $1,413 | $12,770 | $3,600 | $9,170 |
| 2013 | -- | $12,770 | $3,600 | $9,170 |
Source: Public Records
Map
Nearby Homes
- 927 Fishburne Rd
- 1748 Pinopolis Rd
- 310 Land O Pines Cir
- 1636 Pinopolis Rd
- 305 Meadowlark Ln
- 130 Land O Pines Cir
- 1554 Pinopolis Rd
- 601 Levee Dr
- 233 Harlock Dr
- 112 Landerhill Ln
- 1051 Cooper Store Rd
- 120 Nazareth Ln
- 128 Morning View Way
- 172 Morning View Way
- 178 Morning View Way
- 167 Morning View Way
- 168 Morning View Way
- MANNING Plan at Lakeview at Kitfield
- ELSTON Plan at Lakeview at Kitfield
- LITCHFIELD-EXP Plan at Lakeview at Kitfield
- 2005 Summerton Ct
- 2009 Summerton Ct
- 932 Fishburne Rd
- 2045 W Lakeshore Dr
- 2045 W Lake Shore Dr
- 2050 W Lake Shore Dr
- 2054 W Lake Shore Dr
- 2006 Summerton Ct
- 2046 W Lake Shore Dr
- 2015 Summerton Ct
- 940 Fishburne Rd
- 2010 Summerton Ct
- 0 Fishburne Rd
- 2042 W Lake Shore Dr
- 2058 W Lake Shore Dr
- 2019 Summerton Ct
- 1935 Pinopolis Rd
- 2037 W Lake Shore Dr
- 2014 Summerton Ct
- 2023 Summerton Ct