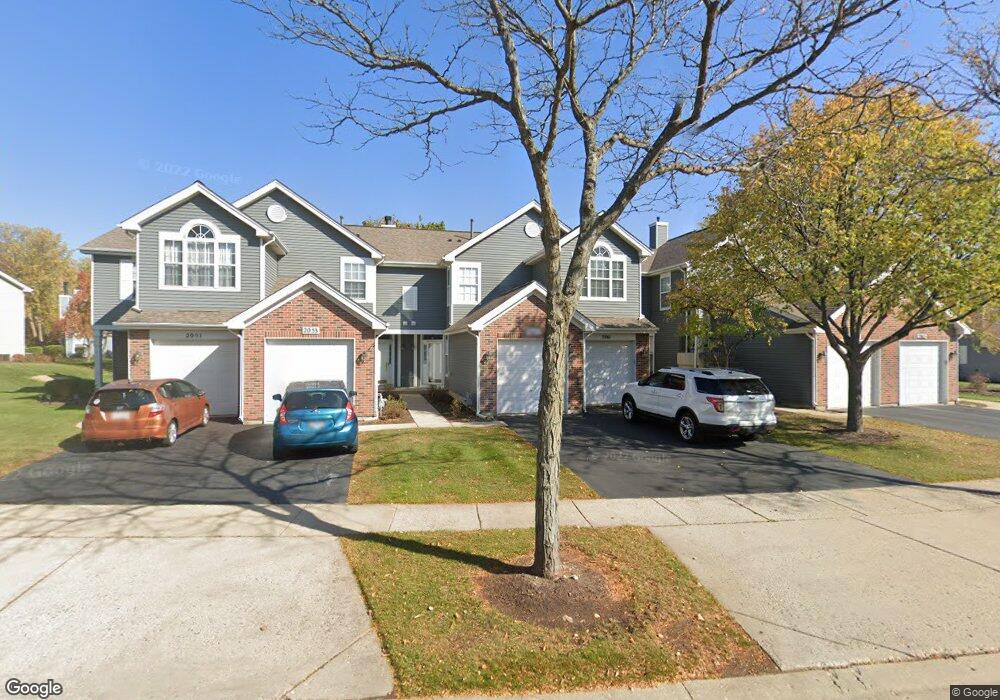
2051 Waverly Ln Unit 4401 Algonquin, IL 60102
Estimated Value: $253,000 - $267,000
2
Beds
--
Bath
1,291
Sq Ft
$200/Sq Ft
Est. Value
About This Home
This home is located at 2051 Waverly Ln Unit 4401, Algonquin, IL 60102 and is currently estimated at $258,530, approximately $200 per square foot. 2051 Waverly Ln Unit 4401 is a home located in Kane County with nearby schools including Westfield Community School and Harry D Jacobs High School.
Ownership History
Date
Name
Owned For
Owner Type
Purchase Details
Closed on
Jul 30, 2015
Sold by
Beissner Christopher M
Bought by
Lossau Wendy M
Current Estimated Value
Home Financials for this Owner
Home Financials are based on the most recent Mortgage that was taken out on this home.
Original Mortgage
$132,275
Outstanding Balance
$104,805
Interest Rate
4.25%
Mortgage Type
FHA
Estimated Equity
$153,725
Purchase Details
Closed on
Sep 27, 2001
Sold by
Sorejian Silvia and Sorejian Kegham
Bought by
Beissner Christopher M
Home Financials for this Owner
Home Financials are based on the most recent Mortgage that was taken out on this home.
Original Mortgage
$121,500
Interest Rate
6.92%
Purchase Details
Closed on
Jun 30, 1995
Sold by
Willoughby Farms Townhomes Ltd Prtnrshp
Bought by
Sorejian Silvia and Sorejian Kegham
Home Financials for this Owner
Home Financials are based on the most recent Mortgage that was taken out on this home.
Original Mortgage
$91,900
Interest Rate
7.79%
Create a Home Valuation Report for This Property
The Home Valuation Report is an in-depth analysis detailing your home's value as well as a comparison with similar homes in the area
Home Values in the Area
Average Home Value in this Area
Purchase History
| Date | Buyer | Sale Price | Title Company |
|---|---|---|---|
| Lossau Wendy M | $145,000 | Baird & Warner Title Svcs In | |
| Beissner Christopher M | $135,000 | -- | |
| Sorejian Silvia | $115,500 | Chicago Title Insurance Co |
Source: Public Records
Mortgage History
| Date | Status | Borrower | Loan Amount |
|---|---|---|---|
| Open | Lossau Wendy M | $132,275 | |
| Previous Owner | Beissner Christopher M | $121,500 | |
| Previous Owner | Sorejian Silvia | $91,900 |
Source: Public Records
Tax History Compared to Growth
Tax History
| Year | Tax Paid | Tax Assessment Tax Assessment Total Assessment is a certain percentage of the fair market value that is determined by local assessors to be the total taxable value of land and additions on the property. | Land | Improvement |
|---|---|---|---|---|
| 2024 | $4,608 | $68,611 | $8,371 | $60,240 |
| 2023 | $4,373 | $61,734 | $7,532 | $54,202 |
| 2022 | $4,236 | $56,692 | $7,532 | $49,160 |
| 2021 | $4,098 | $53,529 | $7,112 | $46,417 |
| 2020 | $4,013 | $52,325 | $6,952 | $45,373 |
| 2019 | $3,878 | $49,673 | $6,600 | $43,073 |
| 2018 | $3,644 | $45,522 | $6,469 | $39,053 |
| 2017 | $3,478 | $42,583 | $6,051 | $36,532 |
| 2016 | $3,557 | $41,231 | $5,859 | $35,372 |
| 2015 | -- | $32,874 | $5,490 | $27,384 |
| 2014 | -- | $31,966 | $5,338 | $26,628 |
| 2013 | -- | $39,319 | $5,501 | $33,818 |
Source: Public Records
Map
Nearby Homes
- 30 Arbordale Ct Unit 4284
- 1900 Waverly Ln
- Marianne Plan at Algonquin Meadows - Traditional Townhomes
- Darcy Plan at Algonquin Meadows - Traditional Townhomes
- Charlotte Plan at Algonquin Meadows - Traditional Townhomes
- 2101 Peach Tree Ln Unit 4094
- Adams Plan at Algonquin Meadows - Single Family
- Sequoia Plan at Algonquin Meadows - Single Family
- Bryce Plan at Algonquin Meadows - Single Family
- Rainier Plan at Algonquin Meadows - Single Family
- Santa Rosa Plan at Algonquin Meadows - Single Family
- Biscayne Plan at Algonquin Meadows - Single Family
- 1971 Peach Tree Ln
- Amherst Plan at Algonquin Meadows - Urban Townhomes
- Chatham Plan at Algonquin Meadows - Urban Townhomes
- Chelsea Plan at Algonquin Meadows - Urban Townhomes
- 2043 Peach Tree Ln Unit 4122
- 1090 Glenmont St
- 1247 Glenmont St
- 1255 Glenmont St
- 2051 Waverly Ln Unit 2051
- 2053 Waverly Ln Unit 4402
- 2063 Waverly Ln Unit 4405
- 2065 Waverly Ln Unit 4406
- 2055 Waverly Ln Unit 4403
- 22 Stonegate Ct Unit 4444
- 18 Stonegate Ct
- 24 Stonegate Ct
- 24 Stonegate Ct Unit 24
- 24 Stonegate Ct Unit 6
- 2042 Waverly Ln Unit 4333
- 36 Stonegate Ct Unit 4451
- 2037 Waverly Ln Unit 4416
- 2031 Waverly Ln Unit 4413
- 2050 Waverly Ln Unit 4346
- 4 Stonegate Ct Unit 4435
- 26 Stonegate Ct
- 28 Stonegate Ct Unit 4441
- 12 Stonegate Ct Unit 4431
- 2040 Waverly Ln Unit 4334