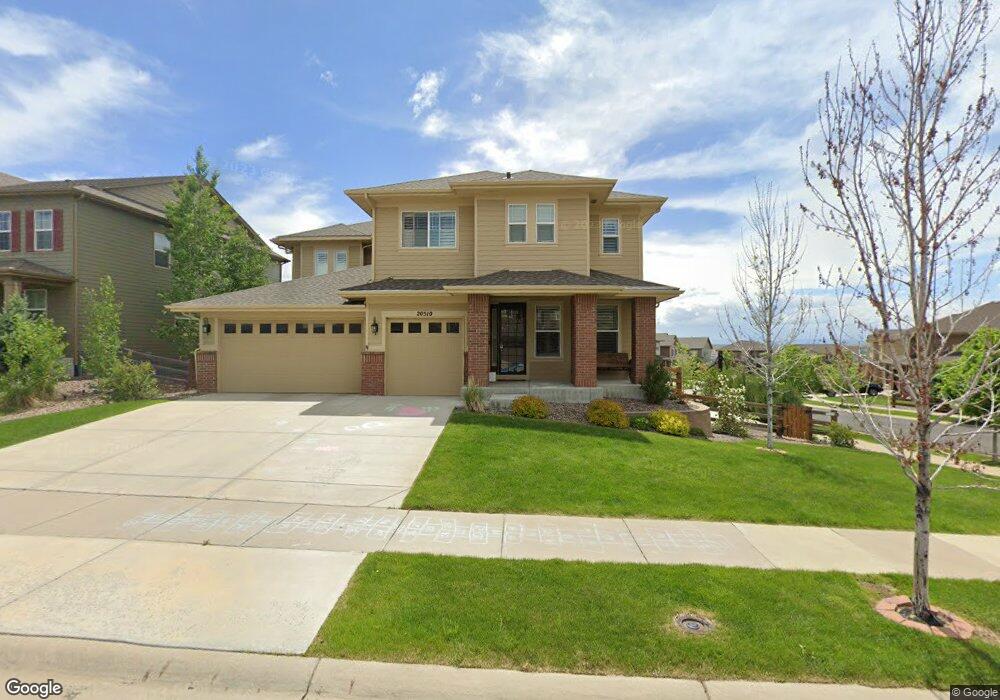
20510 E Shady Ridge Rd Parker, CO 80134
Estimated Value: $851,000 - $954,000
5
Beds
5
Baths
5,504
Sq Ft
$163/Sq Ft
Est. Value
About This Home
This home is located at 20510 E Shady Ridge Rd, Parker, CO 80134 and is currently estimated at $894,800, approximately $162 per square foot. 20510 E Shady Ridge Rd is a home located in Douglas County with nearby schools including Iron Horse Elementary School, Cimarron Middle School, and Legend High School.
Ownership History
Date
Name
Owned For
Owner Type
Purchase Details
Closed on
Apr 20, 2018
Sold by
Swank Brandon and Swank Haley
Bought by
Bryant Christopher K and Bryant Christina A
Current Estimated Value
Home Financials for this Owner
Home Financials are based on the most recent Mortgage that was taken out on this home.
Original Mortgage
$447,965
Outstanding Balance
$382,932
Interest Rate
4.46%
Mortgage Type
New Conventional
Estimated Equity
$511,868
Purchase Details
Closed on
Dec 19, 2012
Sold by
Melody Homes Inc
Bought by
Swank Brandon and Swank Haley
Home Financials for this Owner
Home Financials are based on the most recent Mortgage that was taken out on this home.
Original Mortgage
$417,000
Interest Rate
3.42%
Mortgage Type
New Conventional
Purchase Details
Closed on
May 16, 2012
Sold by
Kw Pine Ridge Llc
Bought by
Melody Homes Inc
Create a Home Valuation Report for This Property
The Home Valuation Report is an in-depth analysis detailing your home's value as well as a comparison with similar homes in the area
Purchase History
| Date | Buyer | Sale Price | Title Company |
|---|---|---|---|
| Bryant Christopher K | $639,950 | First American Title | |
| Swank Brandon | $432,159 | Heritage Title | |
| Melody Homes Inc | $1,650,000 | -- |
Source: Public Records
Mortgage History
| Date | Status | Borrower | Loan Amount |
|---|---|---|---|
| Open | Bryant Christopher K | $447,965 | |
| Previous Owner | Swank Brandon | $417,000 |
Source: Public Records
Tax History
| Year | Tax Paid | Tax Assessment Tax Assessment Total Assessment is a certain percentage of the fair market value that is determined by local assessors to be the total taxable value of land and additions on the property. | Land | Improvement |
|---|---|---|---|---|
| 2025 | $5,846 | $50,180 | $10,410 | $39,770 |
| 2024 | $5,846 | $62,240 | $9,540 | $52,700 |
| 2023 | $5,908 | $62,240 | $9,540 | $52,700 |
| 2022 | $4,551 | $42,750 | $6,430 | $36,320 |
| 2021 | $4,727 | $42,750 | $6,430 | $36,320 |
| 2020 | $4,506 | $41,520 | $7,090 | $34,430 |
| 2019 | $4,529 | $41,520 | $7,090 | $34,430 |
| 2018 | $4,672 | $40,140 | $6,410 | $33,730 |
| 2017 | $4,809 | $40,140 | $6,410 | $33,730 |
| 2016 | $4,969 | $40,930 | $5,970 | $34,960 |
| 2015 | $5,033 | $40,930 | $5,970 | $34,960 |
| 2014 | $4,976 | $37,230 | $5,250 | $31,980 |
Source: Public Records
Map
Nearby Homes
- 20420 Northern Pine Ave
- 20132 E Shady Ridge Rd
- 12094 S Majestic Pine Way
- 21132 Hawthorne Ln
- 12472 S Bellisario Creek Ct
- 12372 S Nate Cir
- 12665 S Robinson Ranch Ct
- 19615 E Clear Creek Trail
- 19590 Glendale Ln
- 11535 Briarwood Ln
- 12640 S Beaver Creek Ct
- 12656 S Dove Creek Way
- 19663 E Mann Creek Dr Unit D
- 12643 S Dove Creek Ct
- 11655 Snowcreek Ln
- 8682 N Sundown Trail
- 19551 E Mann Creek Dr Unit B
- 12000 S Stroll Ln
- 12652 S Silver Creek Ct
- 12770 Ironstone Way Unit 301
- 20528 E Shady Ridge Rd
- 20514 Narrow Pine Ln
- 20464 E Shady Ridge Rd
- 20547 Northern Pine Ave
- 20554 E Shady Ridge Rd
- 20501 E Shady Ridge Rd
- 20482 Narrow Pine Ln
- 20519 E Shady Ridge Rd
- 20483 E Shady Ridge Rd
- 20523 Northern Pine Ave
- 20446 E Shady Ridge Rd
- 20497 Narrow Pine Ln
- 20537 E Shady Ridge Rd
- 20465 E Shady Ridge Rd
- 20460 Narrow Pine Ln
- 20495 Northern Pine Ave
- 20555 E Shady Ridge Rd
- 20455 Narrow Pine Ln
- 20428 E Shady Ridge Rd
- 20447 E Shady Ridge Rd
Your Personal Tour Guide
Ask me questions while you tour the home.