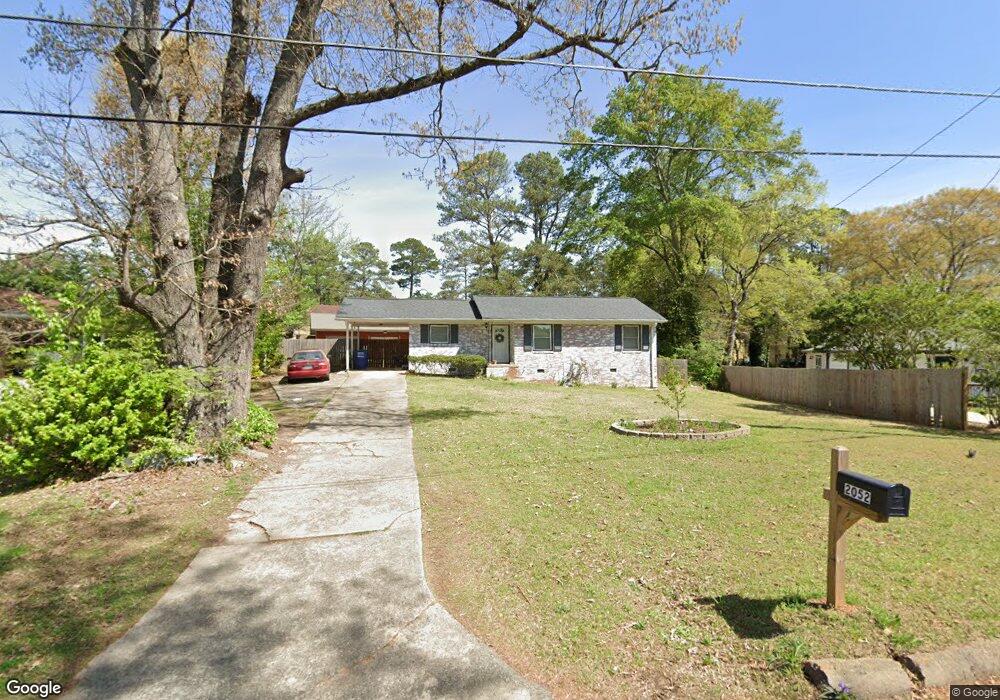
2052 Panstone Ct SW Unit 8 Marietta, GA 30060
Southwestern Marietta NeighborhoodEstimated Value: $270,000 - $289,000
3
Beds
1
Bath
980
Sq Ft
$289/Sq Ft
Est. Value
About This Home
This home is located at 2052 Panstone Ct SW Unit 8, Marietta, GA 30060 and is currently estimated at $283,038, approximately $288 per square foot. 2052 Panstone Ct SW Unit 8 is a home located in Cobb County with nearby schools including LaBelle Elementary School, Griffin Middle School, and Osborne High School.
Ownership History
Date
Name
Owned For
Owner Type
Purchase Details
Closed on
Nov 13, 2023
Sold by
Albert Angelina Teresa
Bought by
Gutierrez Veronica Beatriz and Gutierrez Jhoanna B
Current Estimated Value
Home Financials for this Owner
Home Financials are based on the most recent Mortgage that was taken out on this home.
Original Mortgage
$266,750
Outstanding Balance
$261,860
Interest Rate
7.49%
Mortgage Type
New Conventional
Estimated Equity
$21,178
Purchase Details
Closed on
Jun 14, 2021
Sold by
Sims James
Bought by
Albert Angelina Teresa
Home Financials for this Owner
Home Financials are based on the most recent Mortgage that was taken out on this home.
Original Mortgage
$215,000
Interest Rate
2.9%
Mortgage Type
New Conventional
Purchase Details
Closed on
Dec 18, 2020
Sold by
Trulove Shirley Joe and Mace Shirley J
Bought by
Sims James
Create a Home Valuation Report for This Property
The Home Valuation Report is an in-depth analysis detailing your home's value as well as a comparison with similar homes in the area
Home Values in the Area
Average Home Value in this Area
Purchase History
| Date | Buyer | Sale Price | Title Company |
|---|---|---|---|
| Gutierrez Veronica Beatriz | $275,000 | None Listed On Document | |
| Albert Angelina Teresa | $239,000 | None Available | |
| Sims James | $110,000 | None Available |
Source: Public Records
Mortgage History
| Date | Status | Borrower | Loan Amount |
|---|---|---|---|
| Open | Gutierrez Veronica Beatriz | $266,750 | |
| Previous Owner | Albert Angelina Teresa | $215,000 |
Source: Public Records
Tax History Compared to Growth
Tax History
| Year | Tax Paid | Tax Assessment Tax Assessment Total Assessment is a certain percentage of the fair market value that is determined by local assessors to be the total taxable value of land and additions on the property. | Land | Improvement |
|---|---|---|---|---|
| 2025 | $2,851 | $110,000 | $37,480 | $72,520 |
| 2024 | $2,853 | $110,000 | $37,480 | $72,520 |
| 2023 | $343 | $87,312 | $38,000 | $49,312 |
| 2022 | $548 | $86,912 | $38,000 | $48,912 |
| 2021 | $1,335 | $44,000 | $24,760 | $19,240 |
| 2020 | $1,558 | $51,324 | $26,000 | $25,324 |
| 2019 | $1,578 | $52,000 | $6,000 | $46,000 |
| 2018 | $1,166 | $38,420 | $6,000 | $32,420 |
| 2017 | $1,105 | $38,420 | $6,000 | $32,420 |
| 2016 | $640 | $22,264 | $6,000 | $16,264 |
| 2015 | $656 | $22,264 | $6,000 | $16,264 |
| 2014 | $661 | $22,264 | $0 | $0 |
Source: Public Records
Map
Nearby Homes
- 2078 Olive Springs Rd SE
- 152 Summer Lake Dr SW
- 2245 Panstone Dr SW
- 1958 Judy Cir SE
- 166 Zelma St SW
- 2177 Wakita Dr SE
- 1840 Judy Cir SE
- 1809 Austell Rd SW
- 1763 Sandtown Rd SW
- 2036 Favor Rd SW
- 2379 Olive Springs Rd SE
- 2354 Holly Hill Ct SW
- 29 Burke St SE
- 2675 Sandtown Rd SW
- 81 Cochran Rd SE
- 55 Cochran Rd SE
- 1631 Knox Dr SE
- 2052 Panstone Ct SW
- 2050 Panstone Ct SW
- 2054 Panstone Ct SW
- 2048 Panstone Ct SW
- 2077 Panstone Ct SW
- 2055 Panstone Ct SW
- 0 Panstone Ct SW Unit 7495355
- 0 Panstone Ct SW Unit 3171873
- 0 Panstone Ct SW Unit 8101748
- 0 Panstone Ct SW
- 2076 Panstone Ct SW
- 2046 Panstone Ct SW
- 2047 Panstone Ct SW
- 2048 Olive Springs Rd SE
- 2058 Olive Springs Rd SE
- 2088 Panstone Ct SW
- 2068 Olive Springs Rd SE
- 2037 Panstone Ct SW
- 2044 Panstone Ct SW
- 60 Pat Mell Rd SW