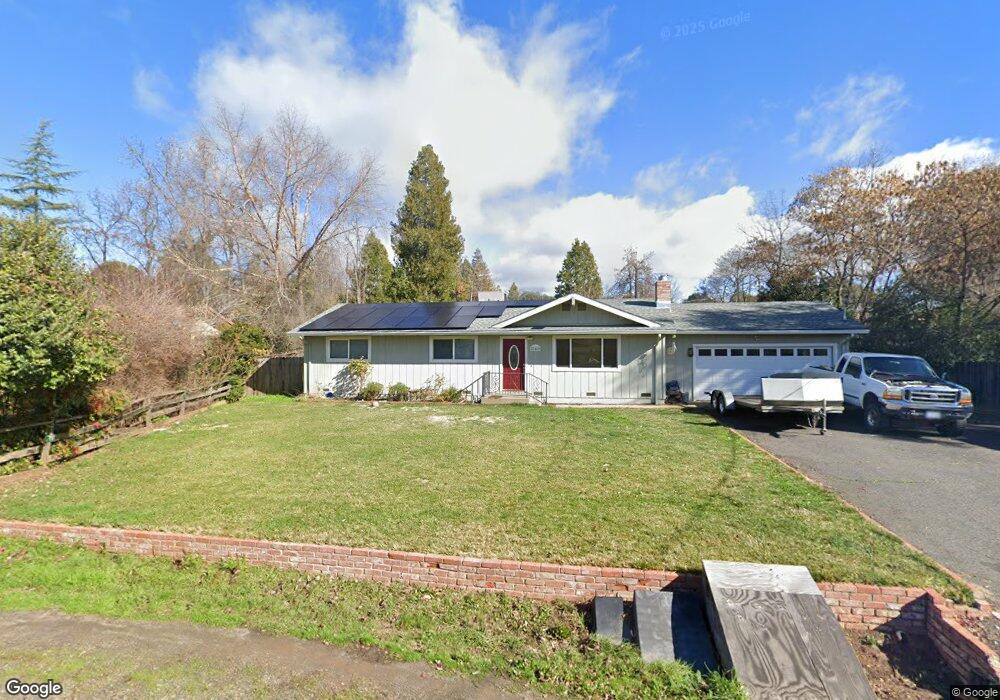
20520 Quail Hollow Ct Sonora, CA 95370
Estimated Value: $397,762 - $490,000
3
Beds
3
Baths
1,668
Sq Ft
$270/Sq Ft
Est. Value
About This Home
This home is located at 20520 Quail Hollow Ct, Sonora, CA 95370 and is currently estimated at $451,191, approximately $270 per square foot. 20520 Quail Hollow Ct is a home located in Tuolumne County with nearby schools including Columbia Elementary School, Sonora High School, and Theodore Bird High School.
Ownership History
Date
Name
Owned For
Owner Type
Purchase Details
Closed on
Jun 28, 2010
Sold by
Giacosa Michael J and Giacosa Celeste S
Bought by
Giacosa Michael J and Giacosa Celeste S
Current Estimated Value
Home Financials for this Owner
Home Financials are based on the most recent Mortgage that was taken out on this home.
Original Mortgage
$162,000
Outstanding Balance
$108,188
Interest Rate
4.82%
Mortgage Type
New Conventional
Estimated Equity
$343,003
Purchase Details
Closed on
Jan 24, 2003
Sold by
Mcginnes John T and Mcginnes Kimberly A
Bought by
Giacosa Michael J and Giacosa Celeste S
Home Financials for this Owner
Home Financials are based on the most recent Mortgage that was taken out on this home.
Original Mortgage
$75,800
Interest Rate
5.97%
Mortgage Type
Purchase Money Mortgage
Create a Home Valuation Report for This Property
The Home Valuation Report is an in-depth analysis detailing your home's value as well as a comparison with similar homes in the area
Home Values in the Area
Average Home Value in this Area
Purchase History
| Date | Buyer | Sale Price | Title Company |
|---|---|---|---|
| Giacosa Michael J | -- | Yosemite Title Company | |
| Giacosa Michael J | -- | Yosemite Title Company | |
| Giacosa Michael J | $223,000 | Fidelity Natl Title Ins Co |
Source: Public Records
Mortgage History
| Date | Status | Borrower | Loan Amount |
|---|---|---|---|
| Open | Giacosa Michael J | $162,000 | |
| Closed | Giacosa Michael J | $75,800 |
Source: Public Records
Tax History Compared to Growth
Tax History
| Year | Tax Paid | Tax Assessment Tax Assessment Total Assessment is a certain percentage of the fair market value that is determined by local assessors to be the total taxable value of land and additions on the property. | Land | Improvement |
|---|---|---|---|---|
| 2025 | $3,395 | $322,970 | $86,896 | $236,074 |
| 2024 | $3,395 | $316,639 | $85,193 | $231,446 |
| 2023 | $3,343 | $310,431 | $83,523 | $226,908 |
| 2022 | $3,282 | $304,345 | $81,886 | $222,459 |
| 2021 | $3,213 | $298,379 | $80,281 | $218,098 |
| 2020 | $3,172 | $295,320 | $79,458 | $215,862 |
| 2019 | $3,066 | $289,530 | $77,900 | $211,630 |
| 2018 | $3,101 | $283,854 | $76,373 | $207,481 |
| 2017 | $2,962 | $278,289 | $74,876 | $203,413 |
| 2016 | $2,905 | $272,833 | $73,408 | $199,425 |
| 2015 | $2,767 | $260,000 | $60,000 | $200,000 |
| 2014 | $1,703 | $160,941 | $43,302 | $117,639 |
Source: Public Records
Map
Nearby Homes
- 20500 Quail Hollow Ct
- 20530 Quail Hollow Ct
- 20475 W Walnut Dr
- 20455 W Walnut Dr
- 20490 Quail Hollow Ct
- 20535 Quail Hollow Ct
- 20505 Quail Hollow Ct
- 20505 W Walnut Dr
- 20515 W Walnut Dr
- 20495 Quail Hollow Ct
- 20585 W Walnut Dr
- 20525 Quail Hollow Ct
- 20485 Quail Hollow Ct
- 20480 Quail Hollow Ct Unit 145
- 20470 W Walnut Dr
- 20480 W Walnut Dr
- 20460 W Walnut Dr
- 20500 W Walnut Dr
- 20490 W Walnut Dr
- 20450 W Walnut Dr