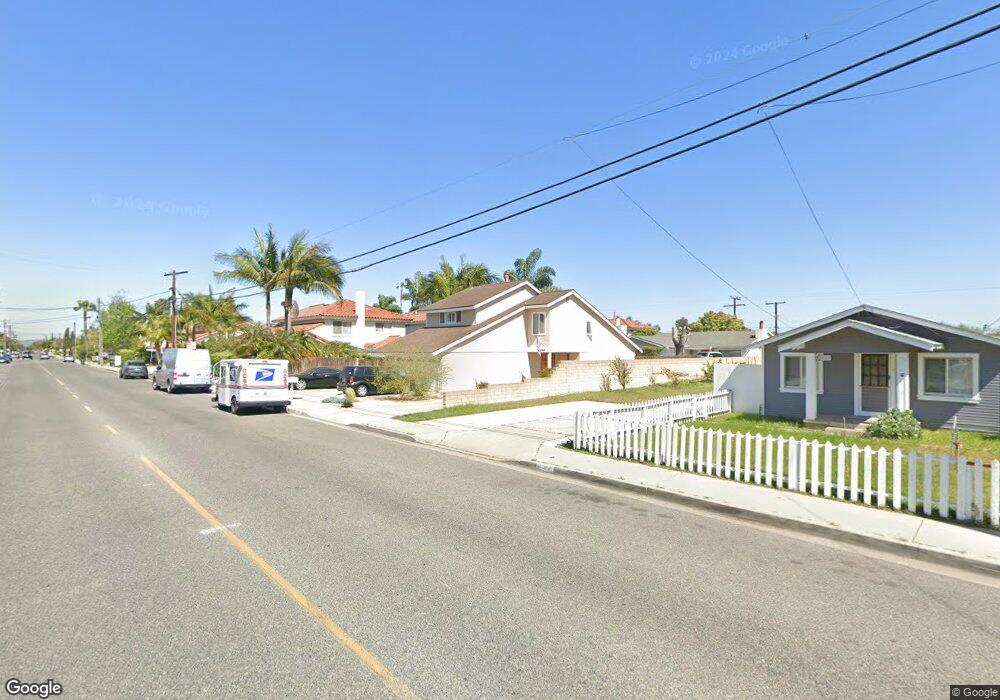
2054 Orange Ave Costa Mesa, CA 92627
Eastside Costa Mesa NeighborhoodEstimated Value: $1,567,000 - $2,030,000
3
Beds
3
Baths
1,536
Sq Ft
$1,132/Sq Ft
Est. Value
About This Home
This home is located at 2054 Orange Ave, Costa Mesa, CA 92627 and is currently estimated at $1,739,484, approximately $1,132 per square foot. 2054 Orange Ave is a home located in Orange County with nearby schools including Heinz Kaiser Elementary School, Woodland Elementary School, and Horace Ensign Intermediate School.
Ownership History
Date
Name
Owned For
Owner Type
Purchase Details
Closed on
Feb 4, 2013
Sold by
Jaskiewicz Matthew Joseph and Jaskiewicz Alisa Backer
Bought by
Jaskiewicz Matthew Joseph and Jaskiewicz Aliso B
Current Estimated Value
Purchase Details
Closed on
Oct 11, 2012
Sold by
Jaskiewicz Matthew Joseph and Jaskiewicz Alisa Backer
Bought by
Jaskiewicz Matthew Joseph and Jaskiewicz Alisa Backer
Home Financials for this Owner
Home Financials are based on the most recent Mortgage that was taken out on this home.
Original Mortgage
$373,500
Outstanding Balance
$64,361
Interest Rate
3.52%
Mortgage Type
New Conventional
Estimated Equity
$1,675,123
Purchase Details
Closed on
Jan 21, 1994
Sold by
Ziroli Alice
Bought by
Ziroli Clement
Purchase Details
Closed on
Dec 16, 1993
Sold by
Ziroli Clement
Bought by
Jaskiewicz Matthew Joseph and Jaskiewicz Alisa Backer
Purchase Details
Closed on
Aug 31, 1993
Sold by
Young James H
Bought by
Ziroli Clement
Create a Home Valuation Report for This Property
The Home Valuation Report is an in-depth analysis detailing your home's value as well as a comparison with similar homes in the area
Home Values in the Area
Average Home Value in this Area
Purchase History
| Date | Buyer | Sale Price | Title Company |
|---|---|---|---|
| Jaskiewicz Matthew Joseph | -- | None Available | |
| Jaskiewicz Matthew Joseph | -- | Lawyers Title Company | |
| Ziroli Clement | -- | United Title Company | |
| Jaskiewicz Matthew Joseph | $200,000 | United Title Company | |
| Ziroli Clement | $199,872 | Ress Financial Corporation |
Source: Public Records
Mortgage History
| Date | Status | Borrower | Loan Amount |
|---|---|---|---|
| Open | Jaskiewicz Matthew Joseph | $373,500 |
Source: Public Records
Tax History
| Year | Tax Paid | Tax Assessment Tax Assessment Total Assessment is a certain percentage of the fair market value that is determined by local assessors to be the total taxable value of land and additions on the property. | Land | Improvement |
|---|---|---|---|---|
| 2025 | $4,680 | $339,921 | $180,321 | $159,600 |
| 2024 | $4,531 | $333,256 | $176,785 | $156,471 |
| 2023 | $4,337 | $326,722 | $173,319 | $153,403 |
| 2022 | $4,113 | $320,316 | $169,920 | $150,396 |
| 2021 | $3,944 | $314,036 | $166,588 | $147,448 |
| 2020 | $3,892 | $310,816 | $164,879 | $145,937 |
| 2019 | $3,807 | $304,722 | $161,646 | $143,076 |
| 2018 | $3,730 | $298,748 | $158,477 | $140,271 |
| 2017 | $3,670 | $292,891 | $155,370 | $137,521 |
| 2016 | $3,594 | $287,149 | $152,324 | $134,825 |
| 2015 | $3,558 | $282,836 | $150,036 | $132,800 |
| 2014 | $3,479 | $277,296 | $147,097 | $130,199 |
Source: Public Records
Map
Nearby Homes
- 2019 Orange Ave
- 201 E 21st St
- 2060 Newport Blvd
- 184 E 21st St
- 224 Pauline Place
- 2076 Tablelands Way
- 1956 Rosemary Place
- 300 Alva Ln
- 1938 Westminster Ave
- 236 Camellia Ln
- 1973 Newport Blvd Unit 3
- 1973 Newport Blvd Unit 10
- 212 E 19th St
- 329 Ford Rd
- 2048 Garden Ln
- 324 Sydney Ln
- 278 Virginia Place
- 401 Bernard St Unit 211
- 401 Bernard St Unit 202
- 425 Ford Rd
- 201 La Costa Ct
- 2056 Orange Ave
- 203 La Costa Ct
- 2048 Orange Ave
- 205 La Costa Ct
- 2044 Orange Ave
- 196 E Bay St
- 197 Buoy St
- 206 La Costa Ct
- 202 La Costa Ct
- 204 La Costa Ct
- 2040 Orange Ave Unit B
- 2040 Orange Ave
- 228 Robinhood Place
- 227 Sherwood Place
- 221 Sherwood Place
- 190 E Bay St
- 207 La Costa Ct
- 191 Buoy St
- 198 Buoy St
Your Personal Tour Guide
Ask me questions while you tour the home.