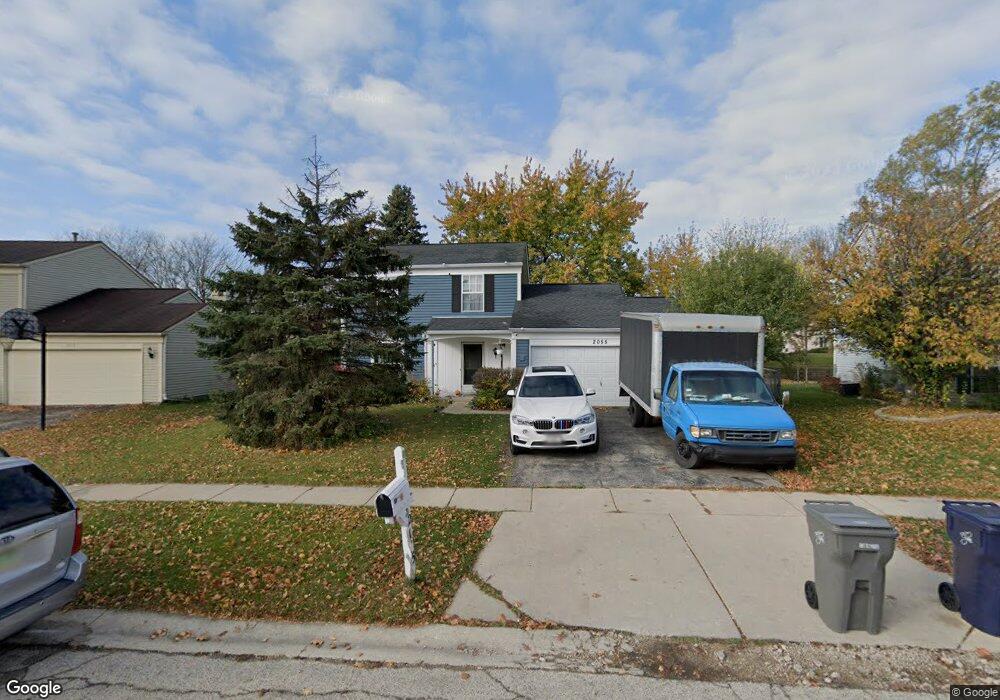
2055 Aronomink Cir Unit 5 Elgin, IL 60123
College Green NeighborhoodEstimated Value: $312,549 - $367,000
3
Beds
2
Baths
1,354
Sq Ft
$247/Sq Ft
Est. Value
About This Home
This home is located at 2055 Aronomink Cir Unit 5, Elgin, IL 60123 and is currently estimated at $333,887, approximately $246 per square foot. 2055 Aronomink Cir Unit 5 is a home located in Kane County with nearby schools including Otter Creek Elementary School, Abbott Middle School, and South Elgin High School.
Ownership History
Date
Name
Owned For
Owner Type
Purchase Details
Closed on
Oct 5, 2020
Sold by
Rodriguez Jose Ruben and Rodriguez Maria J
Bought by
Rodriguez Jonathan Jonathan and Rodriguez Jose R
Current Estimated Value
Purchase Details
Closed on
May 9, 2011
Sold by
Citicorp Trust Bank Fsb
Bought by
Rodriguez Jose Ruben
Purchase Details
Closed on
Dec 20, 2010
Sold by
Amaro Jose M and Citimortgage Inc
Bought by
Citi Corp Trust Bank
Purchase Details
Closed on
Aug 23, 2002
Sold by
Cortese Thomas J and Cortese Catherine L
Bought by
Amaro Jose M and Amaro Josefa
Home Financials for this Owner
Home Financials are based on the most recent Mortgage that was taken out on this home.
Original Mortgage
$172,550
Interest Rate
6.4%
Mortgage Type
FHA
Create a Home Valuation Report for This Property
The Home Valuation Report is an in-depth analysis detailing your home's value as well as a comparison with similar homes in the area
Home Values in the Area
Average Home Value in this Area
Purchase History
| Date | Buyer | Sale Price | Title Company |
|---|---|---|---|
| Rodriguez Jonathan Jonathan | -- | Chicago Title Insurance Co | |
| Rodriguez Jose Ruben | $115,000 | First American Title | |
| Citi Corp Trust Bank | -- | None Available | |
| Amaro Jose M | $180,000 | Chicago Title Insurance Co |
Source: Public Records
Mortgage History
| Date | Status | Borrower | Loan Amount |
|---|---|---|---|
| Previous Owner | Amaro Jose M | $172,550 |
Source: Public Records
Tax History Compared to Growth
Tax History
| Year | Tax Paid | Tax Assessment Tax Assessment Total Assessment is a certain percentage of the fair market value that is determined by local assessors to be the total taxable value of land and additions on the property. | Land | Improvement |
|---|---|---|---|---|
| 2024 | $6,654 | $83,143 | $26,129 | $57,014 |
| 2023 | $6,403 | $75,114 | $23,606 | $51,508 |
| 2022 | $5,939 | $68,491 | $21,525 | $46,966 |
| 2021 | $5,713 | $64,034 | $20,124 | $43,910 |
| 2020 | $5,575 | $61,130 | $19,211 | $41,919 |
| 2019 | $5,439 | $58,230 | $18,300 | $39,930 |
| 2018 | $5,111 | $51,591 | $17,240 | $34,351 |
| 2017 | $5,016 | $48,772 | $16,298 | $32,474 |
| 2016 | $4,826 | $45,247 | $15,120 | $30,127 |
| 2015 | -- | $41,473 | $13,859 | $27,614 |
| 2014 | -- | $40,961 | $13,688 | $27,273 |
| 2013 | -- | $42,041 | $14,049 | $27,992 |
Source: Public Records
Map
Nearby Homes
- 761 Verde Vista Ct Unit 611F
- 2038 College Green Dr
- 611 Woodbridge Dr
- 740 Fairview Ln
- 1141 Delta Ct Unit 255E
- 1044 Reserve Dr
- 9N621 Flora Dr Unit 1
- 500 S Randall Rd
- 391 Cornell Ln
- 2525 Rolling Ridge
- 671 Fieldcrest Dr
- 1458 Woodland Dr
- 2911 Kelly Dr
- 512 Lowell Dr Unit 2
- 270 Nautical Way
- 2464 Emily Ln
- 3102 Holden St
- 1236 Sandhurst Ln Unit 4
- 005 South St
- 1-11 South St
- 2065 Aronomink Cir
- 2045 Aronomink Cir
- 2069 Aronomink Cir
- 2039 Aronomink Cir
- 805 Mesa Dr Unit 583F
- 803 Mesa Dr Unit 582B
- 801 Mesa Dr Unit 581A
- 2050 Aronomink Cir
- 811 Mesa Dr Unit 571F
- 2060 Aronomink Cir
- 817 Mesa Dr Unit 574F
- 813 Mesa Dr Unit 572D
- 815 Mesa Dr Unit 573C
- 2075 Aronomink Cir
- 2070 Aronomink Cir
- 2037 Aronomink Cir
- 2040 Aronomink Cir
- 777 Verde Vista Ct Unit 604A
- 775 Verde Vista Ct Unit 603B
- 771 Verde Vista Ct Unit 601A