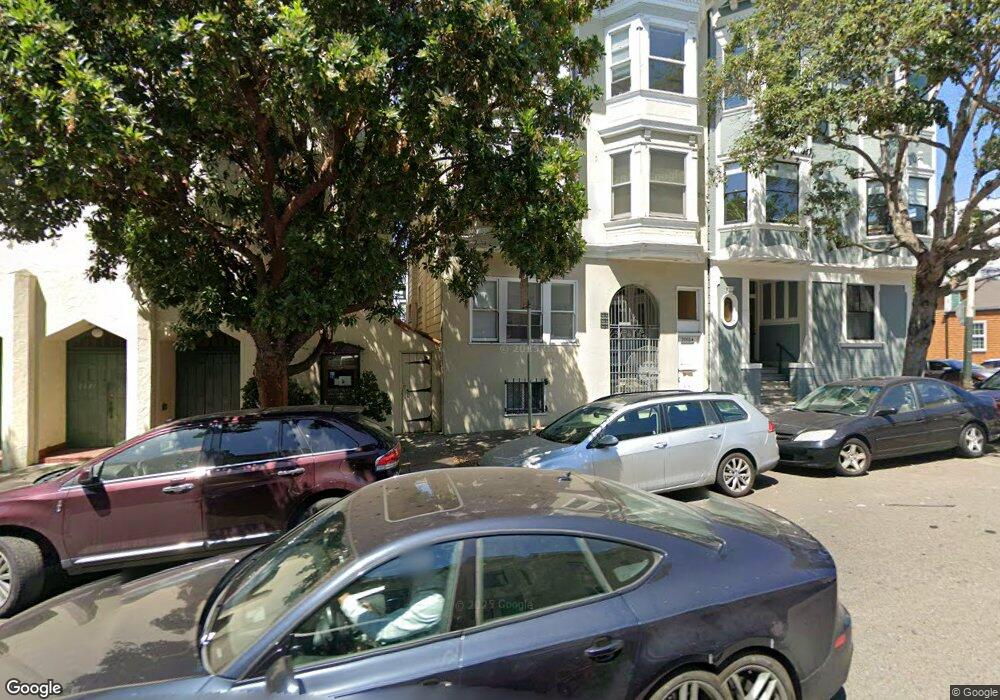
2055 Larkin St Unit 2059 San Francisco, CA 94109
Russian Hill NeighborhoodEstimated Value: $1,831,000 - $2,403,000
8
Beds
6
Baths
4,781
Sq Ft
$434/Sq Ft
Est. Value
About This Home
This home is located at 2055 Larkin St Unit 2059, San Francisco, CA 94109 and is currently estimated at $2,073,000, approximately $433 per square foot. 2055 Larkin St Unit 2059 is a home located in San Francisco County with nearby schools including Yick Wo Elementary School, Francisco Middle School, and Saint Brigid Academy.
Ownership History
Date
Name
Owned For
Owner Type
Purchase Details
Closed on
Feb 6, 2005
Sold by
Lee Mai Jean
Bought by
Lee Mai Jean
Current Estimated Value
Purchase Details
Closed on
Oct 30, 1999
Sold by
Hong Lee Jook and Hong Jean Mai
Bought by
Lee Jook Hong and Lee Mai Jean
Purchase Details
Closed on
Oct 8, 1999
Sold by
Kendall Linda Gordon and Hall Linda G
Bought by
Kendall Linda Gordon
Purchase Details
Closed on
Mar 4, 1994
Sold by
Lee Jook Hong and Lee Mai Jean
Bought by
Lee Jook Hong and Lee Mai Jean
Home Financials for this Owner
Home Financials are based on the most recent Mortgage that was taken out on this home.
Original Mortgage
$170,000
Interest Rate
7%
Mortgage Type
Commercial
Purchase Details
Closed on
Nov 14, 1993
Sold by
Lee Jook Hong and Lee Mai Jean
Bought by
Lee Jook Hong and Lee Mai Jean
Create a Home Valuation Report for This Property
The Home Valuation Report is an in-depth analysis detailing your home's value as well as a comparison with similar homes in the area
Home Values in the Area
Average Home Value in this Area
Purchase History
| Date | Buyer | Sale Price | Title Company |
|---|---|---|---|
| Lee Mai Jean | -- | -- | |
| Lee Jook Hong | -- | -- | |
| Kendall Linda Gordon | -- | -- | |
| Lee Jook Hong | -- | Old Republic Title Company | |
| Lee George K | -- | Old Republic Title Company | |
| Lee Jook Hong | -- | -- | |
| Lee Jook Hong | -- | -- |
Source: Public Records
Mortgage History
| Date | Status | Borrower | Loan Amount |
|---|---|---|---|
| Closed | Lee Jook Hong | $170,000 |
Source: Public Records
Tax History Compared to Growth
Tax History
| Year | Tax Paid | Tax Assessment Tax Assessment Total Assessment is a certain percentage of the fair market value that is determined by local assessors to be the total taxable value of land and additions on the property. | Land | Improvement |
|---|---|---|---|---|
| 2025 | $9,214 | $686,956 | $219,008 | $467,948 |
| 2024 | $9,214 | $673,488 | $214,714 | $458,774 |
| 2023 | $8,938 | $660,284 | $210,504 | $449,780 |
| 2022 | $8,716 | $647,340 | $206,378 | $440,962 |
| 2021 | $8,564 | $634,648 | $202,332 | $432,316 |
| 2020 | $8,764 | $628,142 | $200,258 | $427,884 |
| 2019 | $8,483 | $615,828 | $196,332 | $419,496 |
| 2018 | $8,200 | $603,756 | $192,484 | $411,272 |
| 2017 | $7,810 | $591,918 | $188,710 | $403,208 |
| 2016 | $7,659 | $580,312 | $185,010 | $395,302 |
| 2015 | $7,560 | $571,598 | $182,232 | $389,366 |
| 2014 | $7,370 | $560,404 | $178,664 | $381,740 |
Source: Public Records
Map
Nearby Homes
- 2145 Larkin St
- 1728 Larkin St
- 1725 Hyde St Unit 1
- 1438 Green St Unit 3D
- 2160 Van Ness Ave
- 1601 Pacific Ave Unit 207
- 1601 Hyde St
- 1396 Pacific Ave Unit 1398
- 1250 Vallejo St Unit 7
- 1250 Vallejo St Unit 9
- 74 Lynch St
- 1145 Green St Unit 3
- 68 Lynch St
- 16 Delgado Place
- 1519-1521 Jackson St
- 1650 Jackson St Unit 707
- 1135 Green St
- 1650 Broadway Unit 104
- 1567 Jackson St
- 1754 Larkin St Unit 5
- 2055 - 2059 Larkin St
- 2061 Larkin St
- 2065 Larkin St
- 2063 Larkin St
- 1417 Vallejo St
- 2037 Larkin St Unit 2039
- 2031 Larkin St Unit 2035
- 2035 Larkin St
- 1397 Vallejo St Unit 1399
- 1425 Vallejo St Unit 304
- 1425 Vallejo St Unit 204
- 1425 Vallejo St Unit 203
- 1425 Vallejo St Unit 202
- 1425 Vallejo St Unit 201
- 1425 Vallejo St Unit 107
- 1425 Vallejo St Unit 106
- 1425 Vallejo St Unit 105
- 1425 Vallejo St Unit 104
- 1425 Vallejo St Unit 103
- 1425 Vallejo St Unit 101