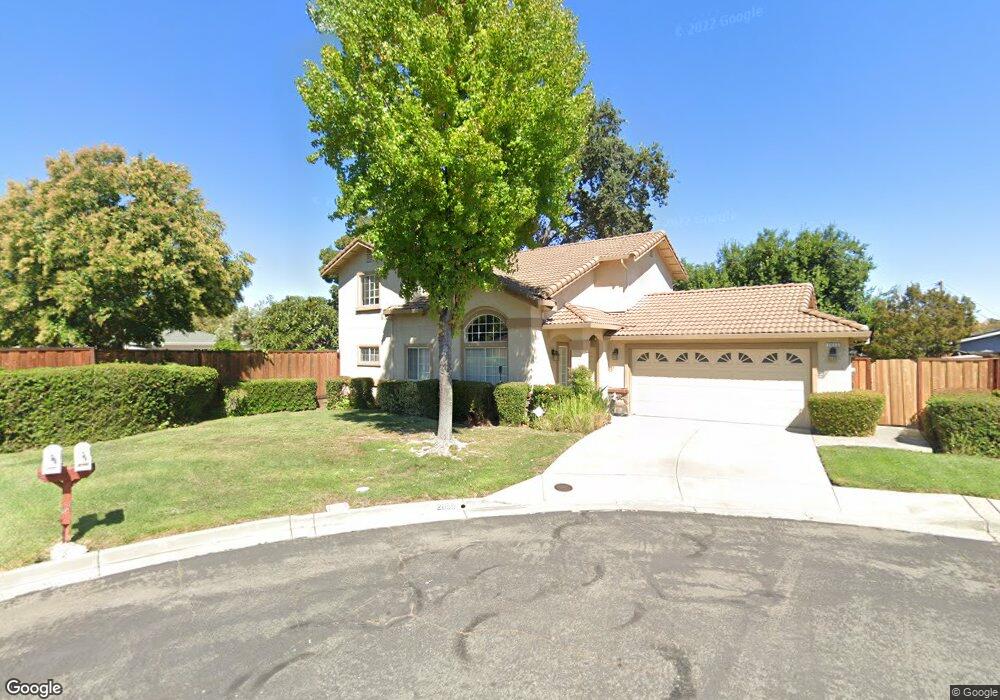
2055 Scally Ct Concord, CA 94518
Ygnacio Valley NeighborhoodEstimated Value: $871,000 - $987,000
4
Beds
3
Baths
1,941
Sq Ft
$483/Sq Ft
Est. Value
About This Home
This home is located at 2055 Scally Ct, Concord, CA 94518 and is currently estimated at $937,453, approximately $482 per square foot. 2055 Scally Ct is a home located in Contra Costa County with nearby schools including Ygnacio Valley Elementary School, Oak Grove Middle School, and Ygnacio Valley High School.
Ownership History
Date
Name
Owned For
Owner Type
Purchase Details
Closed on
Sep 15, 2023
Sold by
Hee Kenneth and Hee Lana
Bought by
Kenneth And Lana Hee Revocable Living Trust and Hee
Current Estimated Value
Purchase Details
Closed on
Sep 10, 2020
Sold by
Hee Kenneth and Hee Lana
Bought by
Hee Kenneth and Hee Lana
Home Financials for this Owner
Home Financials are based on the most recent Mortgage that was taken out on this home.
Original Mortgage
$312,100
Interest Rate
2.9%
Mortgage Type
New Conventional
Purchase Details
Closed on
Jun 20, 1995
Sold by
St Paul Associates Ltd
Bought by
Hee Kenneth and Hee Lana
Home Financials for this Owner
Home Financials are based on the most recent Mortgage that was taken out on this home.
Original Mortgage
$229,200
Interest Rate
7.92%
Mortgage Type
Purchase Money Mortgage
Create a Home Valuation Report for This Property
The Home Valuation Report is an in-depth analysis detailing your home's value as well as a comparison with similar homes in the area
Home Values in the Area
Average Home Value in this Area
Purchase History
| Date | Buyer | Sale Price | Title Company |
|---|---|---|---|
| Kenneth And Lana Hee Revocable Living Trust | -- | None Listed On Document | |
| Hee Kenneth | -- | Amrock | |
| Hee Kenneth | $255,000 | Chicago Title Company |
Source: Public Records
Mortgage History
| Date | Status | Borrower | Loan Amount |
|---|---|---|---|
| Previous Owner | Hee Kenneth | $312,100 | |
| Previous Owner | Hee Kenneth | $229,200 |
Source: Public Records
Tax History Compared to Growth
Tax History
| Year | Tax Paid | Tax Assessment Tax Assessment Total Assessment is a certain percentage of the fair market value that is determined by local assessors to be the total taxable value of land and additions on the property. | Land | Improvement |
|---|---|---|---|---|
| 2025 | $5,438 | $428,127 | $167,955 | $260,172 |
| 2024 | $5,324 | $419,733 | $164,662 | $255,071 |
| 2023 | $5,324 | $411,504 | $161,434 | $250,070 |
| 2022 | $5,241 | $403,436 | $158,269 | $245,167 |
| 2021 | $5,101 | $395,526 | $155,166 | $240,360 |
| 2019 | $4,995 | $383,796 | $150,564 | $233,232 |
| 2018 | $4,797 | $376,271 | $147,612 | $228,659 |
| 2017 | $4,628 | $368,894 | $144,718 | $224,176 |
| 2016 | $4,487 | $361,662 | $141,881 | $219,781 |
| 2015 | $4,489 | $356,230 | $139,750 | $216,480 |
| 2014 | $4,399 | $349,253 | $137,013 | $212,240 |
Source: Public Records
Map
Nearby Homes
- 928 Sassel Ave
- 2745 Minert Rd
- 1766 Risdon Rd
- 825 Oak Grove Rd Unit 46
- 1036 Oak Grove Rd Unit 105
- 1036 Oak Grove Rd Unit 86
- 1036 Oak Grove Rd Unit 21
- 1735 David Ave
- 849 San Simeon Dr
- 2036 Sierra Rd Unit 2
- 3055 Treat Blvd Unit 36
- 3051 Treat Blvd Unit 129
- 2005 Sierra Rd
- 2055 Sierra Rd Unit 101
- 2055 Sierra Rd Unit 82
- 1640 Apple Dr
- 2045 Sierra Rd Unit 2
- 2840 Royal Ann Ln
- 2830 Royal Ann Ln
- 1060 Oak Grove Rd Unit 59