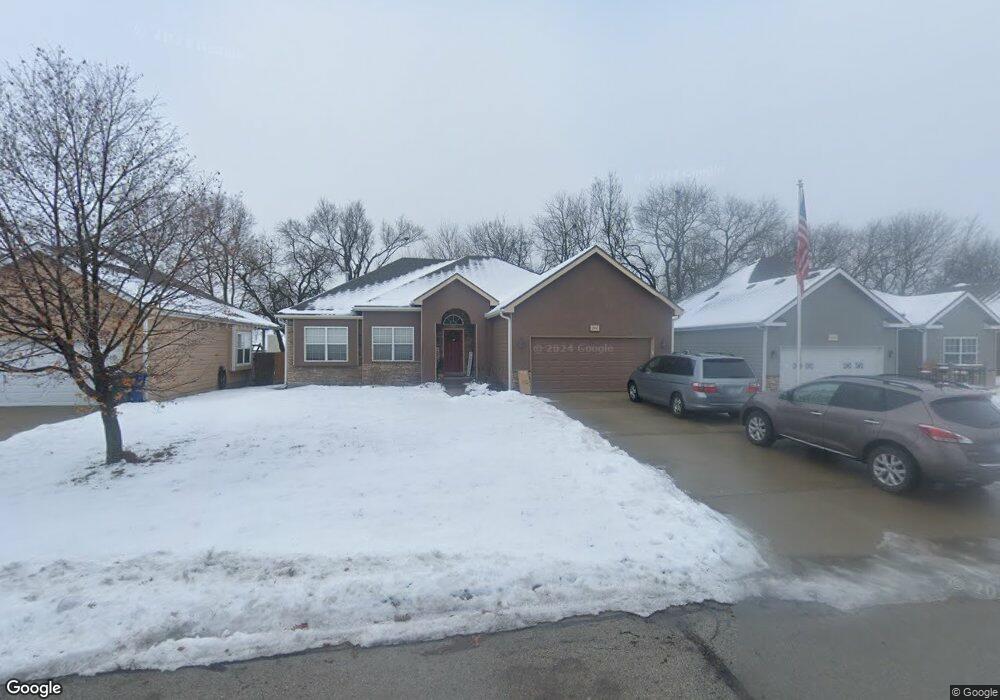
2057 E 25th Place Lawrence, KS 66046
Estimated Value: $342,000 - $371,327
4
Beds
3
Baths
1,426
Sq Ft
$250/Sq Ft
Est. Value
About This Home
This home is located at 2057 E 25th Place, Lawrence, KS 66046 and is currently estimated at $356,582, approximately $250 per square foot. 2057 E 25th Place is a home located in Douglas County with nearby schools including Prairie Park Elementary School, Billy Mills Middle School, and Lawrence High School.
Ownership History
Date
Name
Owned For
Owner Type
Purchase Details
Closed on
Sep 1, 2010
Sold by
Hsbc Mortgage Services Inc
Bought by
Kulkarni Pranjesh K and Tornekar Sarika
Current Estimated Value
Home Financials for this Owner
Home Financials are based on the most recent Mortgage that was taken out on this home.
Original Mortgage
$143,600
Interest Rate
3.12%
Mortgage Type
Adjustable Rate Mortgage/ARM
Purchase Details
Closed on
Jun 17, 2010
Sold by
Jackson Jeney J and Jackson Audra C
Bought by
Hsbc Mortgage Services Inc
Purchase Details
Closed on
Jul 20, 2005
Sold by
Planet Construction Llc
Bought by
Jackson Jeney J and Jackson Audra C
Home Financials for this Owner
Home Financials are based on the most recent Mortgage that was taken out on this home.
Original Mortgage
$164,000
Interest Rate
7.12%
Mortgage Type
New Conventional
Create a Home Valuation Report for This Property
The Home Valuation Report is an in-depth analysis detailing your home's value as well as a comparison with similar homes in the area
Home Values in the Area
Average Home Value in this Area
Purchase History
| Date | Buyer | Sale Price | Title Company |
|---|---|---|---|
| Kulkarni Pranjesh K | $179,500 | Chicago Title Ins Co | |
| Hsbc Mortgage Services Inc | -- | First American Title | |
| Jackson Jeney J | -- | Commerce Title |
Source: Public Records
Mortgage History
| Date | Status | Borrower | Loan Amount |
|---|---|---|---|
| Previous Owner | Kulkarni Pranjesh K | $143,600 | |
| Previous Owner | Jackson Jeney J | $164,000 |
Source: Public Records
Tax History Compared to Growth
Tax History
| Year | Tax Paid | Tax Assessment Tax Assessment Total Assessment is a certain percentage of the fair market value that is determined by local assessors to be the total taxable value of land and additions on the property. | Land | Improvement |
|---|---|---|---|---|
| 2025 | $4,899 | $42,757 | $8,050 | $34,707 |
| 2024 | $4,899 | $39,526 | $7,475 | $32,051 |
| 2023 | $4,914 | $38,215 | $6,900 | $31,315 |
| 2022 | $4,512 | $34,880 | $6,325 | $28,555 |
| 2021 | $4,061 | $30,414 | $5,175 | $25,239 |
| 2020 | $3,809 | $28,693 | $5,175 | $23,518 |
| 2019 | $3,528 | $26,622 | $4,947 | $21,675 |
| 2018 | $3,188 | $23,920 | $4,720 | $19,200 |
| 2017 | $3,068 | $22,770 | $4,720 | $18,050 |
| 2016 | $2,885 | $22,379 | $4,600 | $17,779 |
| 2015 | $2,901 | $22,494 | $4,600 | $17,894 |
| 2014 | $3,004 | $23,506 | $4,600 | $18,906 |
Source: Public Records
Map
Nearby Homes
- 2516 Kensington Rd
- 2108 E 26th Terrace
- 2500 O'Connell Rd
- 2308 Anderson Rd
- 1812 E 29th St
- Zachary Plan at Fairfield Farms
- Xavier Plan at Fairfield Farms
- Thaddeus Plan at Fairfield Farms
- Sutton Plan at Fairfield Farms
- Scorpio Plan at Fairfield Farms
- Porter Plan at Fairfield Farms
- Olivia Plan at Fairfield Farms
- Noah Plan at Fairfield Farms
- Nicholas Plan at Fairfield Farms
- Nadia Plan at Fairfield Farms
- Matthew Plan at Fairfield Farms
- Mateo Plan at Fairfield Farms
- Marius Plan at Fairfield Farms
- Madeline Plan at Fairfield Farms
- Lucas Plan at Fairfield Farms
- 2049 E 25th Place
- 2065 E 25th Place
- 2073 E 25th Place
- 2041 E 25th Place
- 2032 E 26th St
- 2100 E 26th St
- 2028 E 26th St
- 2056 E 25th Place
- 2024 E 26th St
- 2081 E 25th Place
- 2033 E 25th Place
- 2523 Knox Dr
- 2514 Dover Ct
- 2108 E 26th St
- 2515 Dover Ct
- 2020 E 26th St
- 2521 Knox Dr
- 2025 E 25th Place
- 2101 E 25th Place
- 2510 Dover Ct