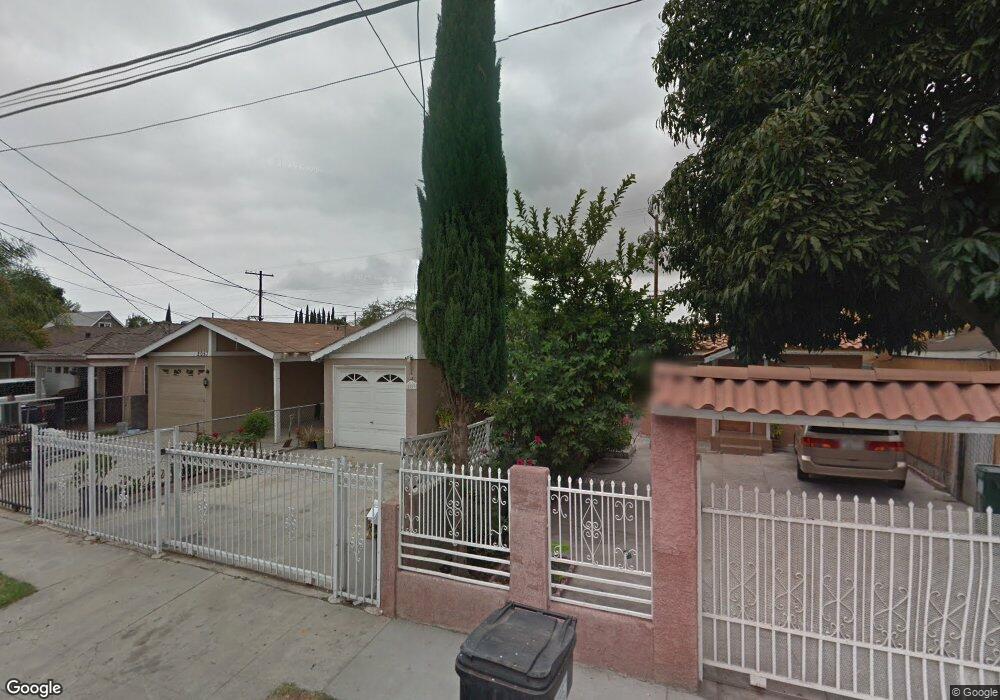
2057 E Oris St Compton, CA 90222
Estimated Value: $495,481 - $555,000
2
Beds
1
Bath
900
Sq Ft
$587/Sq Ft
Est. Value
About This Home
This home is located at 2057 E Oris St, Compton, CA 90222 and is currently estimated at $527,870, approximately $586 per square foot. 2057 E Oris St is a home located in Los Angeles County with nearby schools including Washington Elementary School, Benjamin O. Davis Middle School, and Compton High School.
Ownership History
Date
Name
Owned For
Owner Type
Purchase Details
Closed on
Sep 8, 2020
Sold by
Elizabeth Vazquez Revocable Living Trust
Bought by
Vazquez Elizabeth
Current Estimated Value
Home Financials for this Owner
Home Financials are based on the most recent Mortgage that was taken out on this home.
Original Mortgage
$177,097
Interest Rate
2.9%
Mortgage Type
FHA
Purchase Details
Closed on
Jan 24, 2020
Sold by
Vazquez Elizabeth
Bought by
Elizabeth Vazquez Revocable Livnig Trust
Purchase Details
Closed on
Dec 24, 1997
Sold by
Vazquez Pedro D
Bought by
Vazquez Elizabeth
Home Financials for this Owner
Home Financials are based on the most recent Mortgage that was taken out on this home.
Original Mortgage
$65,000
Interest Rate
7.16%
Create a Home Valuation Report for This Property
The Home Valuation Report is an in-depth analysis detailing your home's value as well as a comparison with similar homes in the area
Home Values in the Area
Average Home Value in this Area
Purchase History
| Date | Buyer | Sale Price | Title Company |
|---|---|---|---|
| Vazquez Elizabeth | -- | Chicago Title | |
| Elizabeth Vazquez Revocable Livnig Trust | -- | None Available | |
| Vazquez Elizabeth | -- | Old Republic Title |
Source: Public Records
Mortgage History
| Date | Status | Borrower | Loan Amount |
|---|---|---|---|
| Closed | Vazquez Elizabeth | $177,097 | |
| Closed | Vazquez Elizabeth | $65,000 |
Source: Public Records
Tax History Compared to Growth
Tax History
| Year | Tax Paid | Tax Assessment Tax Assessment Total Assessment is a certain percentage of the fair market value that is determined by local assessors to be the total taxable value of land and additions on the property. | Land | Improvement |
|---|---|---|---|---|
| 2025 | $2,646 | $167,251 | $77,756 | $89,495 |
| 2024 | $2,646 | $163,973 | $76,232 | $87,741 |
| 2023 | $2,614 | $160,759 | $74,738 | $86,021 |
| 2022 | $2,454 | $157,608 | $73,273 | $84,335 |
| 2021 | $2,489 | $154,519 | $71,837 | $82,682 |
| 2020 | $2,444 | $152,936 | $71,101 | $81,835 |
| 2019 | $2,422 | $149,938 | $69,707 | $80,231 |
| 2018 | $2,339 | $146,999 | $68,341 | $78,658 |
| 2016 | $2,218 | $141,292 | $65,688 | $75,604 |
| 2015 | $2,114 | $139,171 | $64,702 | $74,469 |
| 2014 | $2,082 | $136,446 | $63,435 | $73,011 |
Source: Public Records
Map
Nearby Homes
- 2062 E Hatchway St
- 701 W 139th St
- 521 W Cherry St
- 1701 N Paulsen Ave
- 619 W Cherry St
- 2107 E Stockwell St
- 2036 E Shauer St
- 348 W Peach St
- 2223 E Oris St
- 1808 N Grape Ave
- 2102 E Lucien St
- 720 W Cherry St
- 2021 E Lucien St
- 418 W Spruce St
- 806 W Spruce St
- 13618 S Willowbrook Ave
- 409 W Cedar St
- 905 N Hickory Ave
- 814 W Maple St
- 2401 E Hatchway St
- 2059 E Oris St
- 2055 E Oris St
- 2061 E Oris St
- 2051 E Oris St
- 2063 E Oris St
- 2049 E Oris St
- 2054 E Bliss St
- 2052 E Bliss St
- 2058 E Bliss St
- 2069 E Oris St
- 2050 E Bliss St
- 2045 E Oris St
- 2068 E Bliss St
- 2058 E Oris St
- 2071 E Oris St
- 2046 E Bliss St
- 2060 E Oris St
- 2062 E Oris St
- 2041 E Oris St
- 2046 E Oris St