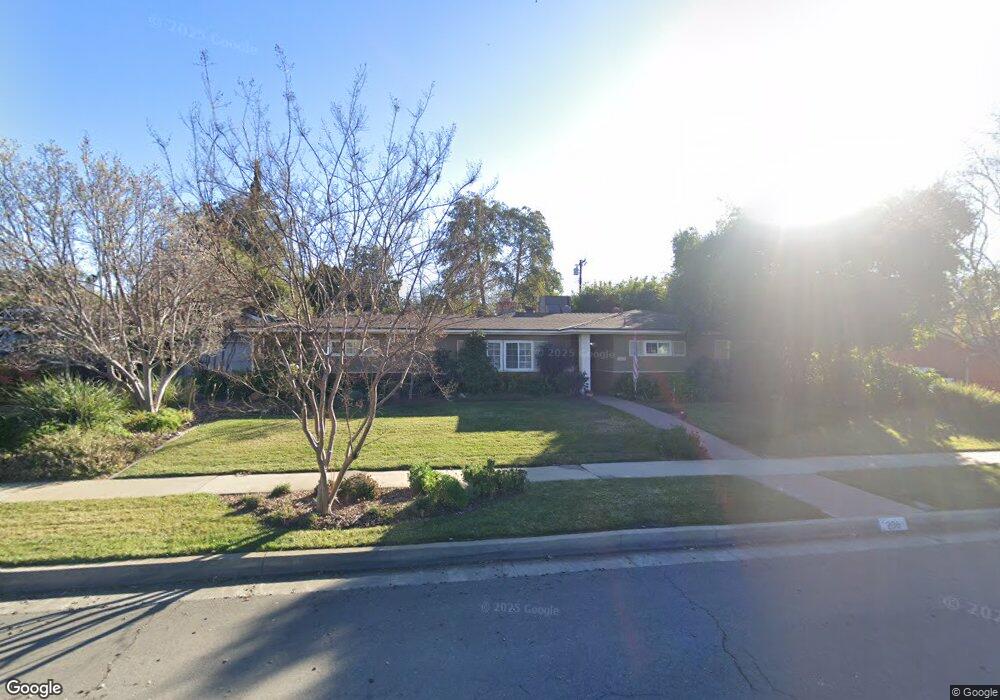
206 Belmont Ct Redlands, CA 92373
South Redlands NeighborhoodEstimated Value: $717,628 - $825,000
4
Beds
3
Baths
2,036
Sq Ft
$386/Sq Ft
Est. Value
About This Home
This home is located at 206 Belmont Ct, Redlands, CA 92373 and is currently estimated at $786,907, approximately $386 per square foot. 206 Belmont Ct is a home located in San Bernardino County with nearby schools including Kimberly Elementary School, Moore Middle School, and Redlands Senior High School.
Ownership History
Date
Name
Owned For
Owner Type
Purchase Details
Closed on
Aug 15, 1998
Sold by
Pelle Joseph E and Pelle Gretchen S
Bought by
Pelle Joseph Edward and Pelle Gretchen Susan
Current Estimated Value
Purchase Details
Closed on
May 19, 1998
Sold by
Pelle Gretchen S and Pelle Edward
Bought by
Pelle Joseph E and Pelle Gretchen S
Home Financials for this Owner
Home Financials are based on the most recent Mortgage that was taken out on this home.
Original Mortgage
$153,100
Interest Rate
7.07%
Purchase Details
Closed on
Dec 23, 1996
Sold by
Pelle Joseph E and Pelle Gretchen S
Bought by
Pelle Joseph Edward and Pelle Gretchen Susan
Create a Home Valuation Report for This Property
The Home Valuation Report is an in-depth analysis detailing your home's value as well as a comparison with similar homes in the area
Home Values in the Area
Average Home Value in this Area
Purchase History
| Date | Buyer | Sale Price | Title Company |
|---|---|---|---|
| Pelle Joseph Edward | -- | -- | |
| Pelle Joseph E | -- | Ati Title Company | |
| Pelle Joseph Edward | -- | -- |
Source: Public Records
Mortgage History
| Date | Status | Borrower | Loan Amount |
|---|---|---|---|
| Closed | Pelle Joseph E | $153,100 |
Source: Public Records
Tax History
| Year | Tax Paid | Tax Assessment Tax Assessment Total Assessment is a certain percentage of the fair market value that is determined by local assessors to be the total taxable value of land and additions on the property. | Land | Improvement |
|---|---|---|---|---|
| 2025 | $3,024 | $248,311 | $58,570 | $189,741 |
| 2024 | $2,823 | $243,443 | $57,422 | $186,021 |
| 2023 | $2,818 | $238,670 | $56,296 | $182,374 |
| 2022 | $2,776 | $233,990 | $55,192 | $178,798 |
| 2021 | $2,825 | $229,402 | $54,110 | $175,292 |
| 2020 | $2,782 | $227,050 | $53,555 | $173,495 |
| 2019 | $2,703 | $222,598 | $52,505 | $170,093 |
| 2018 | $2,634 | $218,233 | $51,475 | $166,758 |
| 2017 | $5,787 | $213,954 | $50,466 | $163,488 |
| 2016 | $5,726 | $209,758 | $49,476 | $160,282 |
| 2015 | $2,560 | $206,607 | $48,733 | $157,874 |
| 2014 | $2,512 | $202,559 | $47,778 | $154,781 |
Source: Public Records
Map
Nearby Homes
- 1514 Franklin Ave
- 225 Sunset Dr
- 1525 Garden St
- 1388 Brandon Ct
- 1617 Garden St
- 1641 Ford St
- 1370 Oak St
- 0 Garden St Unit EV23054640
- 512 Golden West Dr
- 116 Franklin Ave
- 505 E Sunset Dr N
- 533 Via Vista Dr
- 503 Camino Real
- 1702 Dwight St
- 0 Campbell Ave
- 1377 Knoll Rd
- 1550 Marion Rd
- 1400 Elizabeth St
- 261 E Crescent Ave
- 745 W Sunset Dr
- 202 Belmont Ct
- 210 Belmont Ct
- 205 E South Ave
- 201 E South Ave
- 209 E South Ave
- 207 Belmont Ct
- 211 Belmont Ct
- 214 Belmont Ct
- 203 Belmont Ct
- 213 E South Ave
- 215 Belmont Ct
- 140 Belmont Ct
- 129 E South Ave
- 208 E South Ave
- 204 E South Ave
- 218 Belmont Ct
- 208 Anita Ct
- 1503 Franklin Ave
- 141 Belmont Ct
- 212 Anita Ct
Your Personal Tour Guide
Ask me questions while you tour the home.