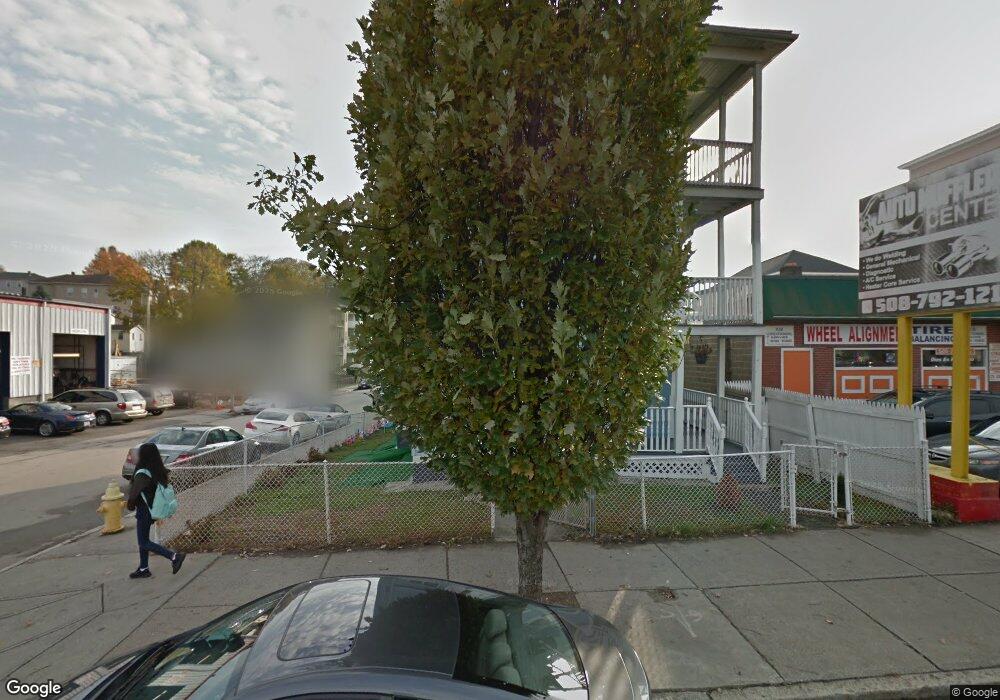
206 Chandler St Worcester, MA 01609
University Park NeighborhoodEstimated Value: $604,617 - $924,000
9
Beds
3
Baths
5,160
Sq Ft
$149/Sq Ft
Est. Value
About This Home
This home is located at 206 Chandler St, Worcester, MA 01609 and is currently estimated at $769,654, approximately $149 per square foot. 206 Chandler St is a home located in Worcester County with nearby schools including Chandler Elementary Community School, Jacob Hiatt Magnet School, and Chandler Magnet.
Ownership History
Date
Name
Owned For
Owner Type
Purchase Details
Closed on
Jan 27, 2004
Sold by
Nguyen Tien Tam
Bought by
Khong Tham
Current Estimated Value
Home Financials for this Owner
Home Financials are based on the most recent Mortgage that was taken out on this home.
Original Mortgage
$234,400
Outstanding Balance
$110,391
Interest Rate
5.89%
Mortgage Type
Purchase Money Mortgage
Estimated Equity
$659,263
Purchase Details
Closed on
Aug 6, 2002
Sold by
1 Princeton St Rt
Bought by
Nguyen Tien Tam
Home Financials for this Owner
Home Financials are based on the most recent Mortgage that was taken out on this home.
Original Mortgage
$180,000
Interest Rate
6.64%
Mortgage Type
Purchase Money Mortgage
Purchase Details
Closed on
Dec 18, 1998
Sold by
Dadah Enterprises
Bought by
Vanvannguyen Duc Van
Purchase Details
Closed on
Dec 29, 1987
Sold by
Bailey Beatrice M
Bought by
Dadah Enterprises
Create a Home Valuation Report for This Property
The Home Valuation Report is an in-depth analysis detailing your home's value as well as a comparison with similar homes in the area
Home Values in the Area
Average Home Value in this Area
Purchase History
| Date | Buyer | Sale Price | Title Company |
|---|---|---|---|
| Khong Tham | $294,000 | -- | |
| Nguyen Tien Tam | $225,000 | -- | |
| 1 Princeton St Rt | $175,000 | -- | |
| Vanvannguyen Duc Van | $62,000 | -- | |
| Dadah Enterprises | $99,000 | -- |
Source: Public Records
Mortgage History
| Date | Status | Borrower | Loan Amount |
|---|---|---|---|
| Open | Khong Tham | $234,400 | |
| Previous Owner | Dadah Enterprises | $180,000 | |
| Previous Owner | Dadah Enterprises | $127,330 | |
| Previous Owner | Dadah Enterprises | $76,000 |
Source: Public Records
Tax History
| Year | Tax Paid | Tax Assessment Tax Assessment Total Assessment is a certain percentage of the fair market value that is determined by local assessors to be the total taxable value of land and additions on the property. | Land | Improvement |
|---|---|---|---|---|
| 2025 | $9,357 | $709,400 | $54,800 | $654,600 |
| 2024 | $8,533 | $620,600 | $54,800 | $565,800 |
| 2023 | $8,161 | $569,100 | $44,000 | $525,100 |
| 2022 | $7,114 | $467,700 | $35,200 | $432,500 |
| 2021 | $6,374 | $391,500 | $28,100 | $363,400 |
| 2020 | $5,831 | $343,000 | $28,200 | $314,800 |
| 2019 | $4,261 | $236,700 | $27,900 | $208,800 |
| 2018 | $4,147 | $219,300 | $27,900 | $191,400 |
| 2017 | $3,867 | $201,200 | $27,900 | $173,300 |
| 2016 | $3,794 | $184,100 | $23,100 | $161,000 |
| 2015 | $3,695 | $184,100 | $23,100 | $161,000 |
| 2014 | $3,597 | $184,100 | $23,100 | $161,000 |
Source: Public Records
Map
Nearby Homes
- 2 Bancroft St
- 204 Chandler St
- 210 Chandler St
- 4 Bancroft St
- 212 Chandler St
- 212 1/2 Chandler St
- 200 Chandler St
- 33 Mason St
- 6 Bancroft St
- 6 Bancroft St Unit 1
- 6 Bancroft St Unit 2
- 6 Bancroft St Unit 3
- 3 Bancroft St
- 35 Mason St
- 37 Mason St
- 5 Bancroft St
- 196 Chandler St
- 194 Chandler St
- 194 Chandler St Unit 3
- 205 Chandler St
Your Personal Tour Guide
Ask me questions while you tour the home.