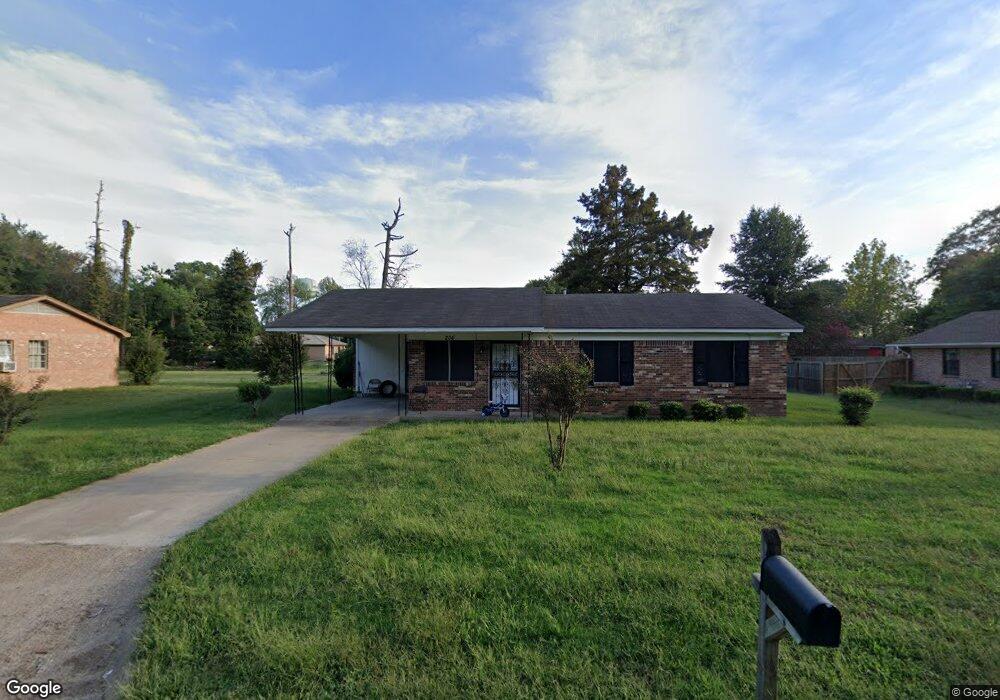
206 Cox St Indianola, MS 38751
Estimated Value: $61,901 - $102,000
3
Beds
--
Bath
1,189
Sq Ft
$63/Sq Ft
Est. Value
About This Home
This home is located at 206 Cox St, Indianola, MS 38751 and is currently estimated at $75,475, approximately $63 per square foot. 206 Cox St is a home with nearby schools including Rosser Early Learning Center, A.W. James Elementary School, and Moorhead Central School.
Ownership History
Date
Name
Owned For
Owner Type
Purchase Details
Closed on
Oct 24, 2022
Sold by
Galloway Wilecia Laroyce
Bought by
Laroyce International Properties Llc
Current Estimated Value
Purchase Details
Closed on
Aug 8, 2022
Sold by
Carpenter Hubert Lee
Bought by
Galloway Wilecia Laroyce
Home Financials for this Owner
Home Financials are based on the most recent Mortgage that was taken out on this home.
Original Mortgage
$50,800
Interest Rate
5.81%
Mortgage Type
New Conventional
Purchase Details
Closed on
Apr 21, 2017
Sold by
Thomas Shirley Bean
Bought by
Sundown Land Company Llc
Purchase Details
Closed on
Jun 24, 2016
Sold by
Janoush Tom
Bought by
Planters Bank And Trust Company Planters Bank
Purchase Details
Closed on
Aug 15, 2014
Bought by
Dees Emily
Purchase Details
Closed on
Apr 26, 2010
Sold by
Carpenter Hubert Lee and Courtney Margaret
Bought by
Carpenter Hubert Lee
Create a Home Valuation Report for This Property
The Home Valuation Report is an in-depth analysis detailing your home's value as well as a comparison with similar homes in the area
Home Values in the Area
Average Home Value in this Area
Purchase History
| Date | Buyer | Sale Price | Title Company |
|---|---|---|---|
| Laroyce International Properties Llc | -- | None Listed On Document | |
| Galloway Wilecia Laroyce | $67,564 | None Listed On Document | |
| Sundown Land Company Llc | -- | None Available | |
| Planters Bank And Trust Company Planters Bank | -- | -- | |
| Dees Emily | -- | -- | |
| Carpenter Hubert Lee | -- | -- |
Source: Public Records
Mortgage History
| Date | Status | Borrower | Loan Amount |
|---|---|---|---|
| Previous Owner | Galloway Wilecia Laroyce | $50,800 |
Source: Public Records
Tax History Compared to Growth
Tax History
| Year | Tax Paid | Tax Assessment Tax Assessment Total Assessment is a certain percentage of the fair market value that is determined by local assessors to be the total taxable value of land and additions on the property. | Land | Improvement |
|---|---|---|---|---|
| 2024 | $1,306 | $7,404 | $525 | $6,879 |
| 2023 | $1,292 | $7,404 | $525 | $6,879 |
| 2022 | $1,297 | $7,404 | $525 | $6,879 |
| 2021 | $1,184 | $6,981 | $525 | $6,456 |
| 2020 | $1,297 | $4,397 | $350 | $4,047 |
| 2019 | $302 | $4,397 | $350 | $4,047 |
| 2018 | $0 | $4,397 | $350 | $4,047 |
| 2017 | $314 | $4,246 | $350 | $3,896 |
| 2016 | $314 | $4,246 | $350 | $3,896 |
| 2015 | -- | $4,095 | $350 | $3,745 |
| 2014 | -- | $6,142 | $525 | $5,617 |
| 2013 | -- | $5,918 | $525 | $5,393 |
Source: Public Records
Map
Nearby Homes
- 514 Lincoln Ave
- 301 Hampton St
- 635 Jefferson St
- 314 Jackson St
- 207 W Percy St
- 204 Cypress Dr
- 107 & 109 E Percy St
- 207 E Percy St
- 602 Magnolia Dr
- 407 E Percy St
- 7 Morningside Dr
- 6 Morningside Dr
- 111 E Gresham St
- 11 Shannon Ferguson Cove
- 701 W Gresham St
- 0 E 82 Hwy Unit 4122425
- 135 Baird Ave
- 4 Little Cir
- 130 Lee Cir
- 305 Seymour Dr