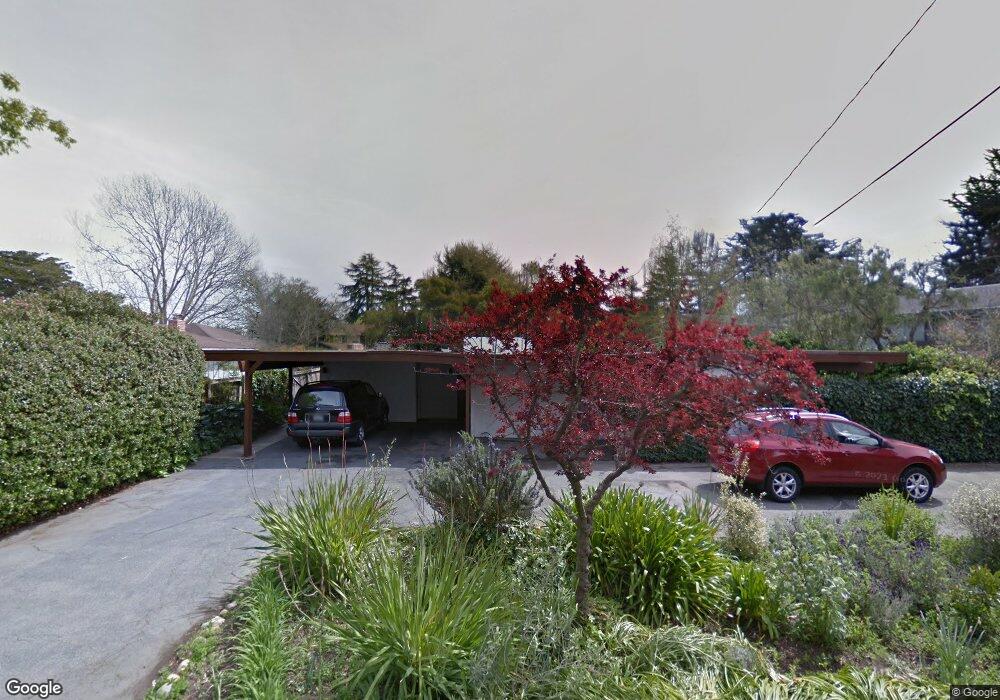
206 Florence Dr Aptos, CA 95003
Rio del Mar NeighborhoodEstimated Value: $1,542,000 - $2,870,000
4
Beds
2
Baths
3,023
Sq Ft
$689/Sq Ft
Est. Value
About This Home
This home is located at 206 Florence Dr, Aptos, CA 95003 and is currently estimated at $2,081,380, approximately $688 per square foot. 206 Florence Dr is a home located in Santa Cruz County with nearby schools including Rio Del Mar Elementary School, Aptos Junior High School, and Aptos High School.
Ownership History
Date
Name
Owned For
Owner Type
Purchase Details
Closed on
Mar 19, 2012
Sold by
Barron Brigid J and Barron Frank
Bought by
Pea Roy D and Barron Brigid J
Current Estimated Value
Home Financials for this Owner
Home Financials are based on the most recent Mortgage that was taken out on this home.
Original Mortgage
$367,000
Outstanding Balance
$251,742
Interest Rate
3.84%
Mortgage Type
New Conventional
Estimated Equity
$1,829,638
Purchase Details
Closed on
May 24, 2006
Sold by
Barron Nancy J
Bought by
Barron Nancy J and Barron Family Trust
Purchase Details
Closed on
Apr 9, 2003
Sold by
Barron Nancy J and The Barron Family Trust
Bought by
Barron Nancy J
Home Financials for this Owner
Home Financials are based on the most recent Mortgage that was taken out on this home.
Original Mortgage
$237,700
Interest Rate
5.6%
Purchase Details
Closed on
Mar 20, 2000
Sold by
Barron Nancy J and Barron Francis X
Bought by
Barron Francis X and Barron Nancy J
Create a Home Valuation Report for This Property
The Home Valuation Report is an in-depth analysis detailing your home's value as well as a comparison with similar homes in the area
Home Values in the Area
Average Home Value in this Area
Purchase History
| Date | Buyer | Sale Price | Title Company |
|---|---|---|---|
| Pea Roy D | $430,000 | First American Title Company | |
| Barron Brigid J | -- | First American Title Company | |
| Barron Nancy J | -- | Accommodation | |
| Barron Nancy J | -- | Stewart Title Of Ca Inc | |
| Barron Francis X | -- | -- |
Source: Public Records
Mortgage History
| Date | Status | Borrower | Loan Amount |
|---|---|---|---|
| Open | Pea Roy D | $367,000 | |
| Previous Owner | Barron Nancy J | $237,700 |
Source: Public Records
Tax History
| Year | Tax Paid | Tax Assessment Tax Assessment Total Assessment is a certain percentage of the fair market value that is determined by local assessors to be the total taxable value of land and additions on the property. | Land | Improvement |
|---|---|---|---|---|
| 2025 | $7,665 | $591,181 | $334,517 | $256,664 |
| 2023 | $7,484 | $568,225 | $321,527 | $246,698 |
| 2022 | $7,307 | $557,083 | $315,223 | $241,860 |
| 2021 | $7,043 | $546,160 | $309,042 | $237,118 |
| 2020 | $6,920 | $540,560 | $305,873 | $234,687 |
| 2019 | $6,795 | $529,960 | $299,875 | $230,085 |
| 2018 | $6,608 | $519,570 | $293,996 | $225,574 |
| 2017 | $6,542 | $509,380 | $288,230 | $221,150 |
| 2016 | $6,384 | $499,393 | $282,579 | $216,814 |
| 2015 | $6,305 | $491,893 | $278,335 | $213,558 |
| 2014 | $6,154 | $482,258 | $272,883 | $209,375 |
Source: Public Records
Map
Nearby Homes
- 320 Cliff Dr
- 325 Beach Dr
- 273 Rio Del Mar Blvd
- 227 Kingsbury Dr
- 240 Rio Del Mar Blvd Unit O
- 229 Rio Del Mar Blvd
- 433 Seaview Dr
- 220 Beach Dr
- 140 Marina Ave Unit A
- 261 Aptos Beach Dr
- 130 Hainline Rd
- 204 Aptos Beach Dr
- 117 Marina Ave
- 118 Marina Ave
- 457 Townsend Dr
- 307 Treasure Island Dr Unit 1
- 347 Treasure Island Dr
- 532 Bayview Dr
- 300 Carrera Cir
- 106 Winfield Way
Your Personal Tour Guide
Ask me questions while you tour the home.