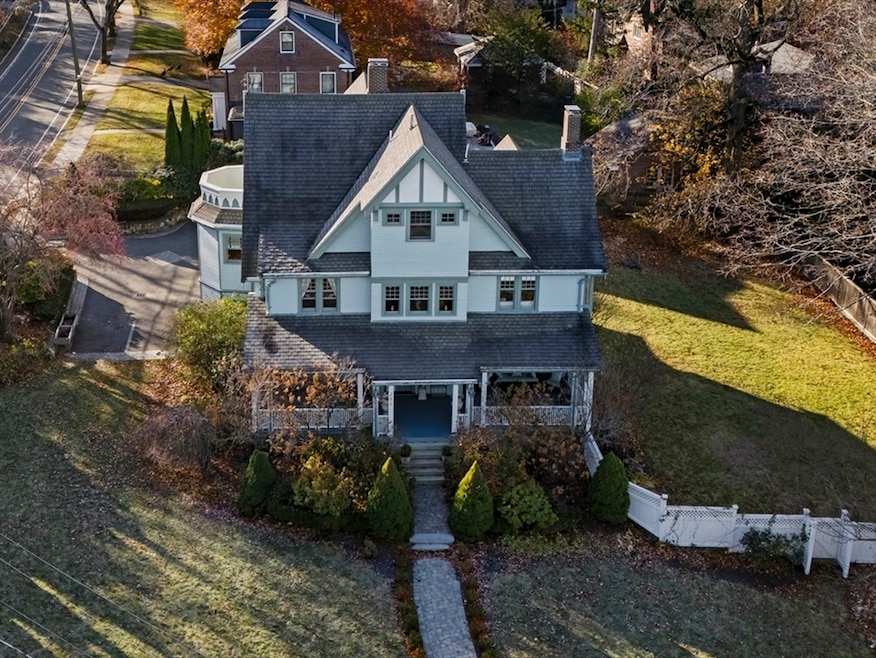
206 Franklin St Newton, MA 02458
Newton Corner NeighborhoodEstimated payment $15,562/month
Highlights
- Popular Property
- Golf Course Community
- Sauna
- Underwood Elementary School Rated A
- Spa
- 5-minute walk to Burr Park
About This Home
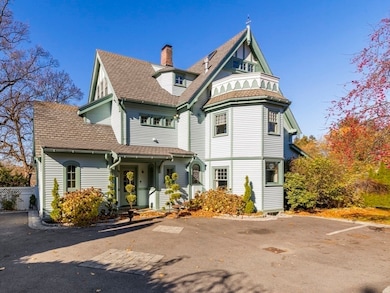
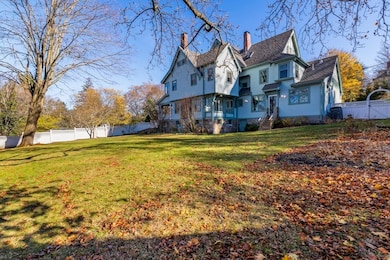
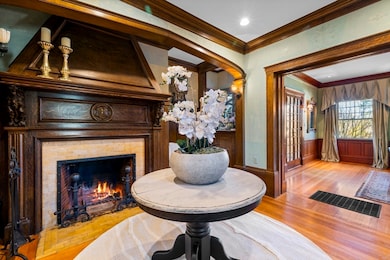
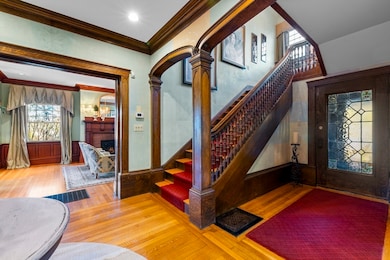
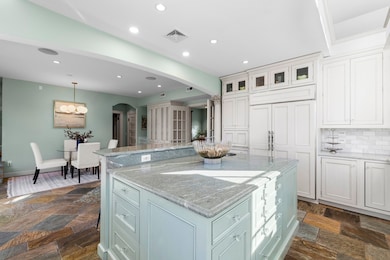
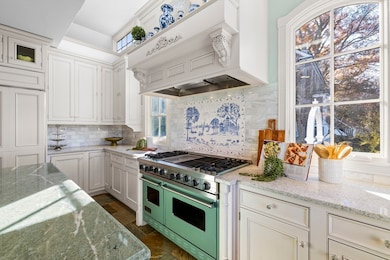
Welcome to 206 Franklin St - a timeless Victorian beauty, where history meets modern luxury on a rare half acre corner parcel in Newton Corner. Built in 1890 and re-imagined for the 21st Century, step inside and find an elegant, sun-drenched 4,500 SF home complete with classic designs and modern finishes including a grand hallway, living room, den, spacious dining room, butler's pantry and 4 fireplaces.The bespoke chef's kitchen is a culinary showstopper, anchored by a gleaming granite island, custom cabinetry and everything you need to cook, gather and celebrate.The 3rd floor master suite is a private retreat beneath cathedral, skylit ceilings, complete with fireplace, sitting area, private balcony, and a spa-worthy bathroom. On the 2nd floor are four more bedrooms and two and a half beautifully designed baths providing room for all. Get ready to enjoy the outdoors with a massive covered front porch and fenced in backyard. Ample parking for 6+ cars with garage and two driveways.
Home Details
Home Type
- Single Family
Est. Annual Taxes
- $28,636
Year Built
- Built in 1890 | Remodeled
Lot Details
- 0.51 Acre Lot
- Corner Lot
- Gentle Sloping Lot
- Property is zoned SR1
Parking
- 1 Car Detached Garage
- Driveway
- Open Parking
- Off-Street Parking
Home Design
- Victorian Architecture
- Stone Foundation
- Frame Construction
- Shingle Roof
Interior Spaces
- 4,500 Sq Ft Home
- Open Floorplan
- Wet Bar
- Wired For Sound
- Crown Molding
- Wainscoting
- Beamed Ceilings
- Cathedral Ceiling
- Skylights
- Recessed Lighting
- Light Fixtures
- Stained Glass
- Bay Window
- Picture Window
- French Doors
- Entrance Foyer
- Living Room with Fireplace
- 4 Fireplaces
- Dining Area
- Sauna
- Center Hall
- Home Security System
Kitchen
- Breakfast Bar
- Oven
- Stove
- Range
- Microwave
- Dishwasher
- Kitchen Island
- Solid Surface Countertops
- Trash Compactor
- Disposal
Flooring
- Wood
- Stone
- Ceramic Tile
Bedrooms and Bathrooms
- 5 Bedrooms
- Fireplace in Primary Bedroom
- Primary bedroom located on third floor
- Cedar Closet
- Linen Closet
- Walk-In Closet
- Dressing Area
- Dual Vanity Sinks in Primary Bathroom
- Bathtub Includes Tile Surround
Laundry
- Laundry on upper level
- Dryer
- Washer
Unfinished Basement
- Walk-Out Basement
- Basement Fills Entire Space Under The House
- Interior and Exterior Basement Entry
- Block Basement Construction
Outdoor Features
- Spa
- Balcony
- Enclosed Patio or Porch
- Rain Gutters
Location
- Property is near public transit
- Property is near schools
Schools
- Underwood Elementary School
- Bigelow Middle School
- Newton North High School
Utilities
- Forced Air Heating and Cooling System
- Heating System Uses Natural Gas
- Radiant Heating System
- 200+ Amp Service
- Gas Water Heater
- High Speed Internet
- Cable TV Available
Listing and Financial Details
- Assessor Parcel Number S:72 B:029 L:0006,702844
Community Details
Overview
- No Home Owners Association
- Near Conservation Area
Amenities
- Shops
Recreation
- Golf Course Community
- Park
- Jogging Path
Map
Home Values in the Area
Average Home Value in this Area
Tax History
| Year | Tax Paid | Tax Assessment Tax Assessment Total Assessment is a certain percentage of the fair market value that is determined by local assessors to be the total taxable value of land and additions on the property. | Land | Improvement |
|---|---|---|---|---|
| 2025 | $28,636 | $2,922,000 | $1,502,000 | $1,420,000 |
| 2024 | $27,688 | $2,836,900 | $1,458,300 | $1,378,600 |
| 2023 | $26,499 | $2,603,000 | $1,148,300 | $1,454,700 |
| 2022 | $25,355 | $2,410,200 | $1,063,200 | $1,347,000 |
| 2021 | $24,466 | $2,273,800 | $1,003,000 | $1,270,800 |
| 2020 | $23,738 | $2,273,800 | $1,003,000 | $1,270,800 |
| 2019 | $23,069 | $2,207,600 | $973,800 | $1,233,800 |
| 2018 | $22,366 | $2,067,100 | $866,900 | $1,200,200 |
| 2017 | $21,685 | $1,950,100 | $817,800 | $1,132,300 |
| 2016 | $20,740 | $1,822,500 | $764,300 | $1,058,200 |
| 2015 | $19,775 | $1,703,300 | $714,300 | $989,000 |
Property History
| Date | Event | Price | List to Sale | Price per Sq Ft |
|---|---|---|---|---|
| 11/20/2025 11/20/25 | For Sale | $2,495,000 | -- | $554 / Sq Ft |
Purchase History
| Date | Type | Sale Price | Title Company |
|---|---|---|---|
| Deed | $1,365,000 | -- | |
| Deed | $590,000 | -- | |
| Deed | $506,000 | -- |
Mortgage History
| Date | Status | Loan Amount | Loan Type |
|---|---|---|---|
| Open | $893,600 | No Value Available | |
| Closed | $1,365,000 | Purchase Money Mortgage | |
| Previous Owner | $15,000 | No Value Available | |
| Previous Owner | $472,000 | Purchase Money Mortgage |
Source: MLS Property Information Network (MLS PIN)
MLS Number: 73456760
APN: NEWT-000072-000029-000006
Disclaimer: Certain information contained herein is derived from information provided by parties other than Homes.com. All information provided is deemed reliable, but is not guaranteed to be accurate and should be independently verified.
![]() The property listing data and information, or the Images, set forth herein were provided to MLS Property Information Network, Inc. from third party sources, including sellers, lessors and public records, and were compiled by MLS Property Information Network, Inc. The property listing data and information, and the Images, are for the personal, non-commercial use of consumers having a good faith interest in purchasing or leasing listed properties of the type displayed to them and may not be used for any purpose other than to identify prospective properties which such consumers may have a good faith interest in purchasing or leasing. MLS Property Information Network, Inc. and its subscribers disclaim any and all representations and warranties as to the accuracy of the property listing data and information, or as to the accuracy of any of the Images, set forth herein.
The property listing data and information, or the Images, set forth herein were provided to MLS Property Information Network, Inc. from third party sources, including sellers, lessors and public records, and were compiled by MLS Property Information Network, Inc. The property listing data and information, and the Images, are for the personal, non-commercial use of consumers having a good faith interest in purchasing or leasing listed properties of the type displayed to them and may not be used for any purpose other than to identify prospective properties which such consumers may have a good faith interest in purchasing or leasing. MLS Property Information Network, Inc. and its subscribers disclaim any and all representations and warranties as to the accuracy of the property listing data and information, or as to the accuracy of any of the Images, set forth herein.
- 106 Farlow Rd
- 59 Hyde Ave
- 548 Centre St Unit 5
- 35 George St Unit 35
- 37 George St Unit 37
- 150 Nonantum St
- 686 Centre St
- 68 Vernon St
- 121 Tremont St Unit B1
- 70 Washington St Unit 70
- 70 Washington St
- 99 Tremont St Unit 105
- 99 Tremont St Unit 413
- 21 Glenley Terrace
- 9 Baldwin St Unit 15C
- 159 Washington St Unit 4
- 180 Hunnewell Ave Unit 180
- 169 Washington St Unit 7
- 12 Richardson St Unit 14
- 8 Tremont Place
- 156 Park St Unit 3
- 14 Hood St Unit B
- 12 Belmont St Unit T
- 12 Belmont St
- 8 Belmont St Unit 1
- 48 Hollis St Unit 5
- 31 George St
- 33 George St Unit 33
- 161 Brayton Rd Unit 1
- 17 Cufflin St Unit 1
- 672 Centre St Unit 1
- 672 Centre St
- 135 Nonantum St
- 135 Nonantum St
- 135 Nonantum St
- 135 Nonantum St Unit T
- 351 Waverley Ave
- 686 Centre St
- 169 Tremont St Unit 2
- 14 Cufflin St Unit 1
