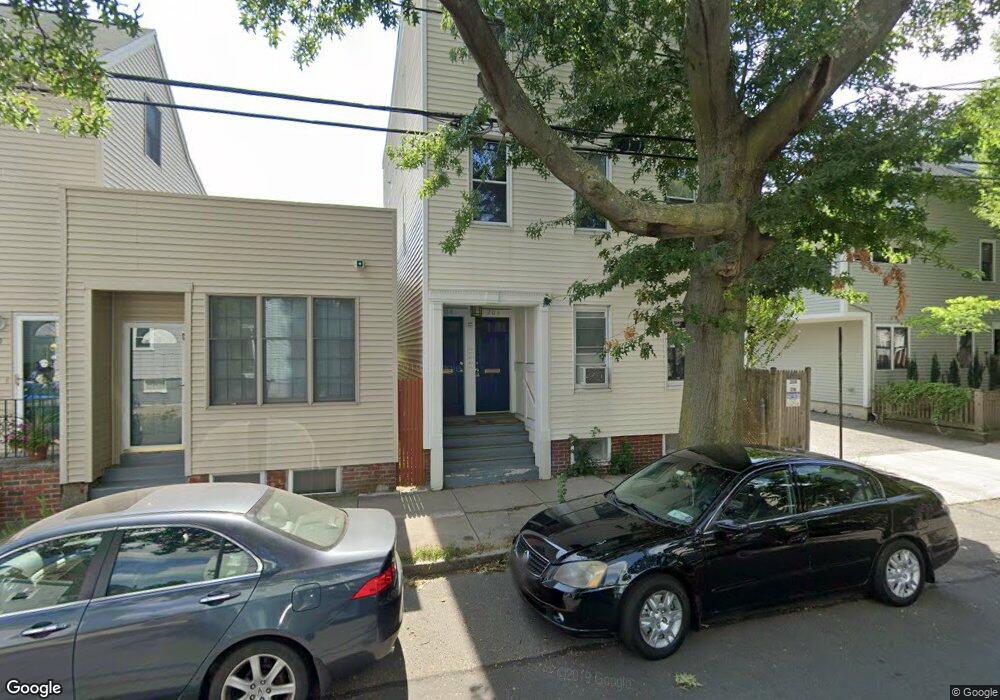
206 Hurley St Unit 2 Cambridge, MA 02141
East Cambridge NeighborhoodEstimated Value: $617,000 - $734,000
2
Beds
1
Bath
658
Sq Ft
$1,017/Sq Ft
Est. Value
About This Home
This home is located at 206 Hurley St Unit 2, Cambridge, MA 02141 and is currently estimated at $669,061, approximately $1,016 per square foot. 206 Hurley St Unit 2 is a home located in Middlesex County with nearby schools including Prospect Hill Academy Charter School, Community Charter School of Cambridge, and Torit Montessori School.
Ownership History
Date
Name
Owned For
Owner Type
Purchase Details
Closed on
Dec 21, 2015
Sold by
Ann Julie and Yuen Norman
Bought by
Yuen Norman
Current Estimated Value
Home Financials for this Owner
Home Financials are based on the most recent Mortgage that was taken out on this home.
Original Mortgage
$252,000
Outstanding Balance
$153,222
Interest Rate
3.89%
Mortgage Type
New Conventional
Estimated Equity
$515,839
Purchase Details
Closed on
Jul 27, 2010
Sold by
Crotty Janice A
Bought by
Yuen Norman and Ann Julie
Home Financials for this Owner
Home Financials are based on the most recent Mortgage that was taken out on this home.
Original Mortgage
$272,000
Interest Rate
4.76%
Mortgage Type
Purchase Money Mortgage
Create a Home Valuation Report for This Property
The Home Valuation Report is an in-depth analysis detailing your home's value as well as a comparison with similar homes in the area
Home Values in the Area
Average Home Value in this Area
Purchase History
| Date | Buyer | Sale Price | Title Company |
|---|---|---|---|
| Yuen Norman | -- | -- | |
| Yuen Norman | $320,000 | -- |
Source: Public Records
Mortgage History
| Date | Status | Borrower | Loan Amount |
|---|---|---|---|
| Open | Yuen Norman | $252,000 | |
| Previous Owner | Yuen Norman | $272,000 |
Source: Public Records
Tax History Compared to Growth
Tax History
| Year | Tax Paid | Tax Assessment Tax Assessment Total Assessment is a certain percentage of the fair market value that is determined by local assessors to be the total taxable value of land and additions on the property. | Land | Improvement |
|---|---|---|---|---|
| 2025 | $3,635 | $572,500 | $0 | $572,500 |
| 2024 | $3,222 | $544,300 | $0 | $544,300 |
| 2023 | $3,253 | $555,100 | $0 | $555,100 |
| 2022 | $3,266 | $551,700 | $0 | $551,700 |
| 2021 | $3,197 | $546,500 | $0 | $546,500 |
| 2020 | $3,152 | $548,100 | $0 | $548,100 |
| 2019 | $3,016 | $507,800 | $0 | $507,800 |
| 2018 | $2,927 | $465,400 | $0 | $465,400 |
| 2017 | $2,704 | $416,600 | $0 | $416,600 |
| 2016 | $2,546 | $364,300 | $0 | $364,300 |
| 2015 | $2,491 | $318,600 | $0 | $318,600 |
| 2014 | $2,397 | $286,000 | $0 | $286,000 |
Source: Public Records
Map
Nearby Homes
- 133 Charles St Unit 133
- 50 Spring St
- 95 2nd St Unit 3
- 76-78 Thorndike St
- 30 2nd St Unit 2
- 30 2nd St Unit 1
- 30 2nd St Unit 1 & 2
- 10 Rogers St Unit 308
- 10 Rogers St Unit 415
- 10 Rogers St Unit 231
- 10 Rogers St Unit 229
- 10 Rogers St Unit PH19
- 10 Rogers St Unit 203
- 17 Otis St Unit 602
- 68 Gore St
- 36 Sciarappa St
- 25 6th St
- 59 7th St Unit 2
- 59 7th St Unit 1
- 59 7th St Unit 3
- 206 Hurley St Unit 3
- 206 Hurley St Unit 1
- 204 Hurley St Unit 1
- 204 Hurley St
- 204 Hurley St Unit 3
- 202 Hurley St
- 200 Hurley St
- 175 3rd St
- 175 3rd St Unit 2
- 175 3rd St
- 175 3rd St Unit 1
- 208 Hurley St
- 177 3rd St
- 212 Hurley St
- 210 Hurley St
- 214 Hurley St
- 181 3rd St
- 181 3rd St Unit 503
- 181 3rd St Unit 3
- 183 3rd St Unit 6