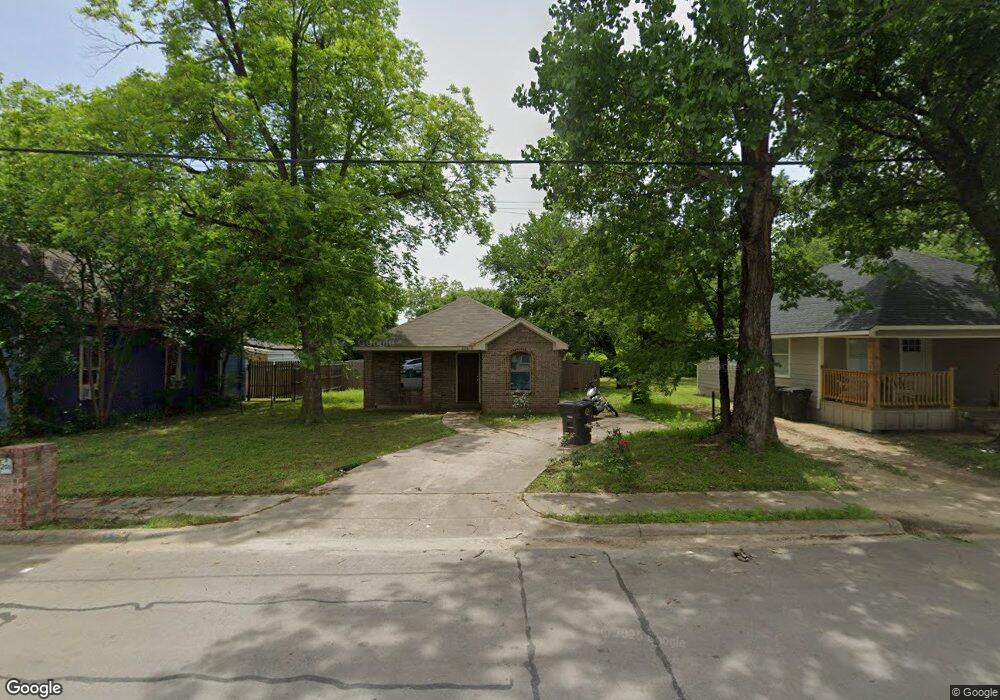
206 Olive St Cleburne, TX 76031
Estimated Value: $192,181 - $222,000
3
Beds
2
Baths
1,170
Sq Ft
$174/Sq Ft
Est. Value
About This Home
This home is located at 206 Olive St, Cleburne, TX 76031 and is currently estimated at $203,045, approximately $173 per square foot. 206 Olive St is a home located in Johnson County with nearby schools including Santa Fe Elementary School, Lowell Smith Jr. Middle School, and Cleburne High School.
Ownership History
Date
Name
Owned For
Owner Type
Purchase Details
Closed on
Jun 22, 2020
Sold by
Jkt Real Estate Inc
Bought by
Smith Alexander
Current Estimated Value
Home Financials for this Owner
Home Financials are based on the most recent Mortgage that was taken out on this home.
Original Mortgage
$133,000
Outstanding Balance
$117,894
Interest Rate
3.2%
Mortgage Type
New Conventional
Estimated Equity
$85,151
Purchase Details
Closed on
May 11, 2005
Sold by
County Of Johnson
Bought by
Panda Land Llc
Create a Home Valuation Report for This Property
The Home Valuation Report is an in-depth analysis detailing your home's value as well as a comparison with similar homes in the area
Home Values in the Area
Average Home Value in this Area
Purchase History
| Date | Buyer | Sale Price | Title Company |
|---|---|---|---|
| Smith Alexander | -- | Providence Title Company | |
| Panda Land Llc | $1,700 | None Available |
Source: Public Records
Mortgage History
| Date | Status | Borrower | Loan Amount |
|---|---|---|---|
| Open | Smith Alexander | $133,000 |
Source: Public Records
Tax History Compared to Growth
Tax History
| Year | Tax Paid | Tax Assessment Tax Assessment Total Assessment is a certain percentage of the fair market value that is determined by local assessors to be the total taxable value of land and additions on the property. | Land | Improvement |
|---|---|---|---|---|
| 2025 | $3,412 | $153,030 | $43,000 | $110,030 |
| 2024 | $3,412 | $153,030 | $43,000 | $110,030 |
| 2023 | $2,971 | $133,530 | $23,500 | $110,030 |
| 2022 | $3,342 | $133,530 | $23,500 | $110,030 |
| 2021 | $3,484 | $133,530 | $23,500 | $110,030 |
| 2020 | $2,959 | $106,787 | $20,000 | $86,787 |
| 2019 | $3,155 | $106,787 | $20,000 | $86,787 |
| 2018 | $1,909 | $64,582 | $7,500 | $57,082 |
| 2017 | $1,901 | $64,582 | $7,500 | $57,082 |
| 2016 | $1,901 | $64,582 | $7,500 | $57,082 |
| 2015 | $1,738 | $64,582 | $7,500 | $57,082 |
| 2014 | $1,738 | $65,203 | $7,500 | $57,703 |
Source: Public Records
Map
Nearby Homes
- 204 Robbins St
- 731 E Brown St
- 605 Olive St
- 407 N Wilhite St
- 612 N Robinson St
- 614 N Robinson St
- 938 E Henderson St
- 109 N Kouns St
- 101 Sandy St
- 709 N Wilhite St Unit 711
- 1300 N Brazos Ave
- 1308 N Brazos Ave
- 603 N Anglin St
- 1014 Trinity St
- 1033 Spring Azure Dr
- 5540-5556 County Road 406
- 8225 Farm To Market 1434
- 106 Columbia St
- 438 Sabine Ave
- 1024 Alvarado St
- 204 Olive St
- 208 Olive St
- 202 Olive St
- 605 E Willingham St
- 609 E Willingham St
- 607 E Willingham St
- 205 Olive St
- 603 E Willingham St
- 212 Olive St
- 207 Olive St
- 200 Olive St
- 613 E Willingham St
- 201 Olive St
- 302 Olive St
- 301 Olive St
- 615 E Willingham St
- 303 Olive St
- 511 E Willingham St
- 206 Royal St
- 606 E Willingham St