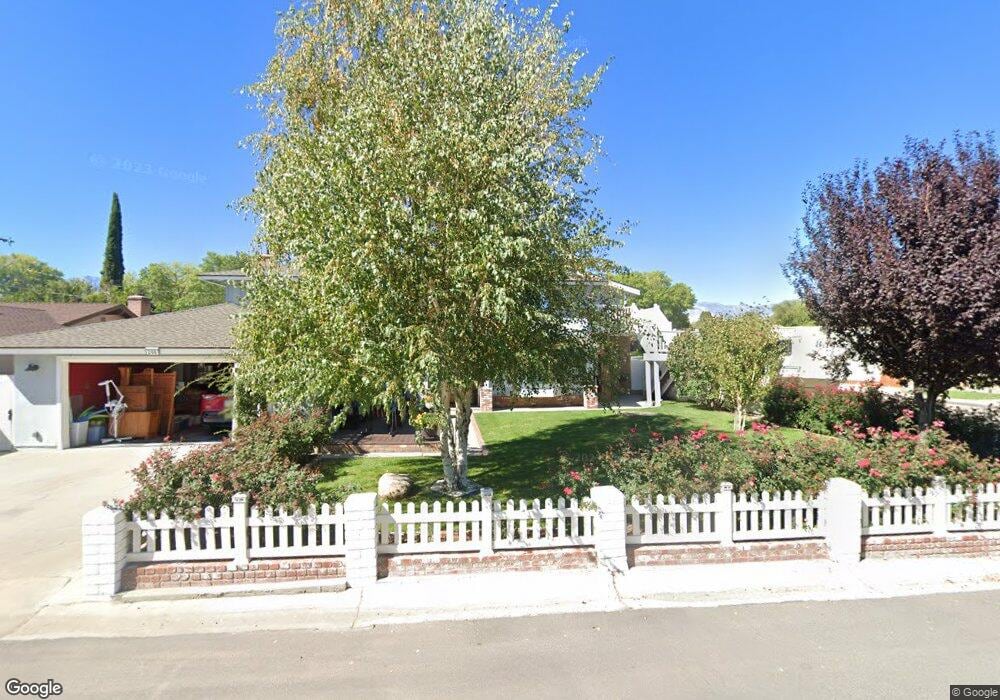
206 Pa Me Ln Bishop, CA 93514
Estimated Value: $685,000 - $865,000
About This Home
This home is located at 206 Pa Me Ln, Bishop, CA 93514 and is currently estimated at $807,394, approximately $263 per square foot. 206 Pa Me Ln is a home located in Inyo County with nearby schools including Bishop Elementary School, Home Street Middle School, and Bishop Union High School.
Ownership History
We collect this data history from publicly available records. To have your information removed, we recommend requesting removal directly through your county’s website.
Purchase Details
Purchase Details
Purchase Details
Home Financials for this Owner
Home Financials are based on the most recent Mortgage that was taken out on this home.Purchase Details
Home Financials for this Owner
Home Financials are based on the most recent Mortgage that was taken out on this home.Home Values in the Area
Average Home Value in this Area
Purchase History
We collect this data history from publicly available records. To have your information removed, we recommend requesting removal directly through your county’s website.
| Date | Buyer | Sale Price | Title Company |
|---|---|---|---|
| -- | None Listed On Document | ||
| -- | -- | ||
| -- | Inyo Mono Title Company | ||
| $445,000 | Mountain Title Company |
Mortgage History
We collect this data history from publicly available records. To have your information removed, we recommend requesting removal directly through your county’s website.
| Date | Status | Borrower | Loan Amount |
|---|---|---|---|
| Previous Owner | $332,000 | ||
| Previous Owner | $263,500 |
Tax History
We collect this data history from publicly available records. To have your information removed, we recommend requesting removal directly through your county’s website.
| Year | Tax Paid | Tax Assessment Tax Assessment Total Assessment is a certain percentage of the fair market value that is determined by local assessors to be the total taxable value of land and additions on the property. | Land | Improvement |
|---|---|---|---|---|
| 2025 | $6,934 | $641,782 | $250,902 | $390,880 |
| 2024 | $6,604 | $629,199 | $245,983 | $383,216 |
| 2023 | $6,454 | $616,862 | $241,160 | $375,702 |
| 2022 | $5,221 | $604,768 | $236,432 | $368,336 |
| 2021 | $5,221 | $490,000 | $150,000 | $340,000 |
| 2020 | $4,638 | $445,521 | $132,535 | $312,986 |
| 2019 | $4,638 | $437,000 | $130,000 | $307,000 |
| 2018 | $4,518 | $426,700 | $122,400 | $304,300 |
| 2017 | $4,337 | $410,000 | $120,000 | $290,000 |
| 2016 | $4,133 | $387,600 | $120,000 | $267,600 |
| 2015 | $4,033 | $380,000 | $120,000 | $260,000 |
| 2014 | $3,870 | $365,000 | $120,000 | $245,000 |
Map
- 132 Desiderata Ln
- 120 Desiderata Ln
- 324 Mclaren Ln
- 112 Mclaren Ln
- 370 Ranch Rd
- 690 Summer Haze Cir
- 1443 Shelly Creek Rd
- 2322 Galloway Ave
- 2281 Fiora Ave
- 2268 Mcgalliard Ave
- 1521 Matlick Ln
- 2297 Brigadoon Ave
- 2234 Brigadoon Ave
- 236 Lagoon St
- 331 S Warren St
- 331 S Warren St Unit A-B-C
- 2432 West St
- 263 E Line St Unit F
- 363 Short St
- 0 US Highway 6
- 224 Pa Me Ln
- 205 Wildrose Ln
- 223 Wildrose Ln Unit 10
- 236 Pa Me Ln
- 248 Pa Me Ln
- 247 Wildrose Ln
- 176 Pa Me Ln
- 166 Pa Me Ln
- 266 Pa Me Ln
- 222 Wildrose Ln
- 204 Wildrose Ln
- 265 Wildrose Ln
- 2957 Birch St
- 234 Wildrose Ln
- 278 Pa Me Ln
- 246 Wildrose Ln
- 277 Wildrose Ln
- 225 Grandview Dr Unit 64
- 225 Grandview Dr
- 264 Wildrose Ln
Ask me questions while you tour the home.