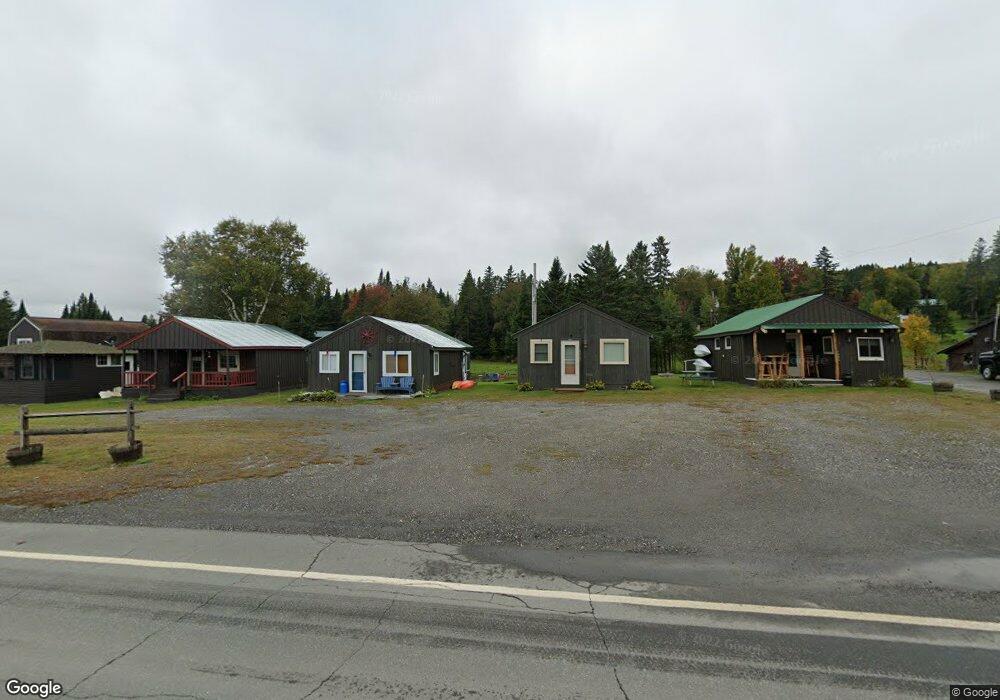
2061 N Main St Pittsburg, NH 03592
Estimated Value: $205,142 - $293,000
2
Beds
1
Bath
600
Sq Ft
$400/Sq Ft
Est. Value
About This Home
This home is located at 2061 N Main St, Pittsburg, NH 03592 and is currently estimated at $240,286, approximately $400 per square foot. 2061 N Main St is a home located in Coos County with nearby schools including Pittsburg Elementary/Middle School and Pittsburg High School.
Ownership History
Date
Name
Owned For
Owner Type
Purchase Details
Closed on
Nov 22, 2016
Sold by
Davidson Jeffrey M and Davison Cheryl K
Bought by
Ecklund Lawrence M
Current Estimated Value
Home Financials for this Owner
Home Financials are based on the most recent Mortgage that was taken out on this home.
Original Mortgage
$79,200
Outstanding Balance
$63,584
Interest Rate
3.42%
Mortgage Type
Unknown
Estimated Equity
$176,702
Create a Home Valuation Report for This Property
The Home Valuation Report is an in-depth analysis detailing your home's value as well as a comparison with similar homes in the area
Home Values in the Area
Average Home Value in this Area
Purchase History
| Date | Buyer | Sale Price | Title Company |
|---|---|---|---|
| Ecklund Lawrence M | $99,000 | -- |
Source: Public Records
Mortgage History
| Date | Status | Borrower | Loan Amount |
|---|---|---|---|
| Open | Ecklund Lawrence M | $79,200 |
Source: Public Records
Tax History Compared to Growth
Tax History
| Year | Tax Paid | Tax Assessment Tax Assessment Total Assessment is a certain percentage of the fair market value that is determined by local assessors to be the total taxable value of land and additions on the property. | Land | Improvement |
|---|---|---|---|---|
| 2024 | $1,763 | $183,600 | $58,800 | $124,800 |
| 2023 | $1,918 | $199,800 | $75,000 | $124,800 |
| 2022 | $1,571 | $98,800 | $27,600 | $71,200 |
| 2021 | $1,537 | $98,800 | $27,600 | $71,200 |
| 2020 | $1,556 | $98,800 | $27,600 | $71,200 |
| 2019 | $1,581 | $98,800 | $27,600 | $71,200 |
| 2018 | $1,421 | $93,600 | $27,600 | $66,000 |
| 2016 | $898 | $57,200 | $3,900 | $53,300 |
| 2015 | $831 | $51,000 | $3,900 | $47,100 |
| 2014 | $880 | $51,000 | $3,900 | $47,100 |
| 2013 | $852 | $51,000 | $3,900 | $47,100 |
Source: Public Records
Map
Nearby Homes