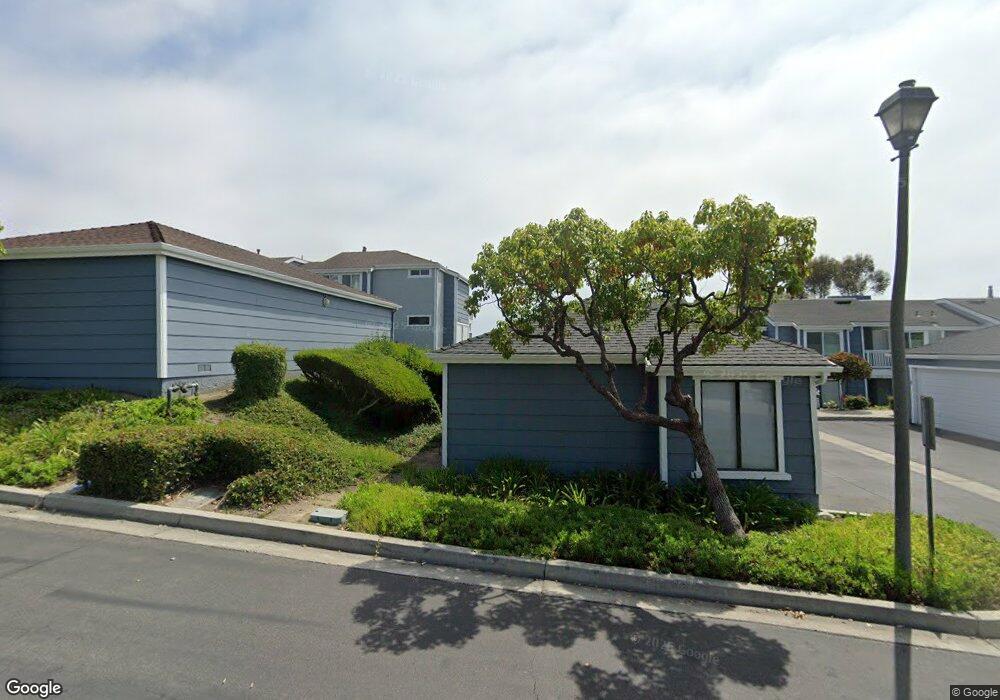
2061 Via Concha San Clemente, CA 92673
Marblehead NeighborhoodEstimated Value: $850,625 - $916,000
2
Beds
1
Bath
984
Sq Ft
$903/Sq Ft
Est. Value
About This Home
This home is located at 2061 Via Concha, San Clemente, CA 92673 and is currently estimated at $888,406, approximately $902 per square foot. 2061 Via Concha is a home located in Orange County with nearby schools including Marblehead Elementary School, Shorecliffs Middle School, and San Clemente High School.
Ownership History
Date
Name
Owned For
Owner Type
Purchase Details
Closed on
Oct 3, 2023
Sold by
Ramos James Owen and Ramos Corinne Renee
Bought by
James Owen Ramos And Corinne Renee Ramos Revo and Ramos
Current Estimated Value
Purchase Details
Closed on
Jan 26, 2021
Sold by
Clark Young Dorothy and The Dorothy Clark Young Trust
Bought by
Ramos James Owen and Ramos Corinne Renee
Home Financials for this Owner
Home Financials are based on the most recent Mortgage that was taken out on this home.
Original Mortgage
$631,960
Interest Rate
2.7%
Mortgage Type
VA
Purchase Details
Closed on
Jun 23, 2009
Sold by
Clark Young Dorothy
Bought by
Clark Young Dorothy
Create a Home Valuation Report for This Property
The Home Valuation Report is an in-depth analysis detailing your home's value as well as a comparison with similar homes in the area
Home Values in the Area
Average Home Value in this Area
Purchase History
| Date | Buyer | Sale Price | Title Company |
|---|---|---|---|
| James Owen Ramos And Corinne Renee Ramos Revo | -- | None Listed On Document | |
| Ramos James Owen | $610,000 | California Title Company | |
| Clark Young Dorothy | -- | None Available |
Source: Public Records
Mortgage History
| Date | Status | Borrower | Loan Amount |
|---|---|---|---|
| Previous Owner | Ramos James Owen | $631,960 |
Source: Public Records
Tax History
| Year | Tax Paid | Tax Assessment Tax Assessment Total Assessment is a certain percentage of the fair market value that is determined by local assessors to be the total taxable value of land and additions on the property. | Land | Improvement |
|---|---|---|---|---|
| 2025 | $6,494 | $660,282 | $551,989 | $108,293 |
| 2024 | $6,494 | $647,336 | $541,166 | $106,170 |
| 2023 | $6,426 | $634,644 | $530,555 | $104,089 |
| 2022 | $6,304 | $622,200 | $520,151 | $102,049 |
| 2021 | $3,092 | $304,231 | $167,406 | $136,825 |
| 2020 | $3,061 | $301,112 | $165,689 | $135,423 |
| 2019 | $3,001 | $295,208 | $162,440 | $132,768 |
| 2018 | $2,944 | $289,420 | $159,255 | $130,165 |
| 2017 | $2,816 | $283,746 | $156,133 | $127,613 |
| 2016 | $2,831 | $278,183 | $153,072 | $125,111 |
| 2015 | $2,789 | $274,005 | $150,773 | $123,232 |
| 2014 | $2,735 | $268,638 | $147,819 | $120,819 |
Source: Public Records
Map
Nearby Homes
- 2127 Avenida Espada Unit 210
- 2162 Calle Ola Verde Unit 182
- 2176 Calle Ola Verde
- 2109 Calle Ola Verde Unit 134
- 2113 Calle Ola Verde
- 524 E Avenida Pico
- 2009 Via Aguila
- 1509 Avenida de la Estrella
- 2000 Corte Cardelina
- 110 Calle Redondel
- 145 Calle Redondel
- 158 Calle Redondel
- 110 Via Murcia
- 125 Via Murcia
- 604 Calle Chayote
- 124 Via Galicia
- 121 La Ronda
- 103 Via Escorial
- 1520 N El Camino Real Unit 11
- 1520 N El Camino Real Unit 10
- 2061 Via Concha Unit 218
- 2063 Via Concha
- 2065 Via Concha Unit 217G
- 2057 Via Concha Unit 219
- 2055 Via Concha Unit 119
- 2053 Via Concha Unit B
- 2051 Via Concha Unit 120
- 2035 Via Concha
- 2033 Via Concha Unit 137
- 2033 Via Concha
- 2029 Via Concha Unit 138
- 2029 Via Concha
- 2027 Via Concha Unit 239
- 2025 Via Concha Unit 139G
- 2023 Via Concha
- 2021 Via Concha
- 2017 Via Concha
- 2015 Via Concha Unit 141
- 2015 Via Concha
- 2013 Via Concha Unit 242G
Your Personal Tour Guide
Ask me questions while you tour the home.