2061 W Redlands Blvd Unit 12E Redlands, CA 92373
West Redlands NeighborhoodEstimated Value: $391,000 - $419,000
3
Beds
3
Baths
1,444
Sq Ft
$279/Sq Ft
Est. Value
About This Home
This home is located at 2061 W Redlands Blvd Unit 12E, Redlands, CA 92373 and is currently estimated at $402,724, approximately $278 per square foot. 2061 W Redlands Blvd Unit 12E is a home located in San Bernardino County with nearby schools including Mission Elementary School, Cope Middle School, and Redlands Senior High School.
Ownership History
Date
Name
Owned For
Owner Type
Purchase Details
Closed on
Nov 1, 2024
Sold by
Starbuck Sophie and Starbuck David
Bought by
Sophie Starbuck And David Starbuck Joint Livi and Starbuck
Current Estimated Value
Purchase Details
Closed on
Dec 17, 2001
Sold by
Starbuck David Leroy and Starbuck Sophia Lynn
Bought by
Starbuck David Leroy and Starbuck Sophia L
Home Financials for this Owner
Home Financials are based on the most recent Mortgage that was taken out on this home.
Original Mortgage
$67,259
Interest Rate
6.39%
Mortgage Type
VA
Purchase Details
Closed on
Apr 8, 1996
Sold by
Cunningham R Gregory and Cunningham Carol J
Bought by
Starbuck David Leroy and Starbuck Sophia Lynn
Home Financials for this Owner
Home Financials are based on the most recent Mortgage that was taken out on this home.
Original Mortgage
$68,340
Interest Rate
7.68%
Mortgage Type
VA
Create a Home Valuation Report for This Property
The Home Valuation Report is an in-depth analysis detailing your home's value as well as a comparison with similar homes in the area
Home Values in the Area
Average Home Value in this Area
Purchase History
| Date | Buyer | Sale Price | Title Company |
|---|---|---|---|
| Sophie Starbuck And David Starbuck Joint Livi | -- | Accommodation/Courtesy Recordi | |
| Starbuck David Leroy | -- | Fidelity National Title Ins | |
| Starbuck David Leroy | $67,000 | Chicago Title Co |
Source: Public Records
Mortgage History
| Date | Status | Borrower | Loan Amount |
|---|---|---|---|
| Previous Owner | Starbuck David Leroy | $67,259 | |
| Previous Owner | Starbuck David Leroy | $68,340 |
Source: Public Records
Tax History
| Year | Tax Paid | Tax Assessment Tax Assessment Total Assessment is a certain percentage of the fair market value that is determined by local assessors to be the total taxable value of land and additions on the property. | Land | Improvement |
|---|---|---|---|---|
| 2025 | $1,440 | $112,968 | $33,227 | $79,741 |
| 2024 | $1,347 | $110,752 | $32,575 | $78,177 |
| 2023 | $1,345 | $108,580 | $31,936 | $76,644 |
| 2022 | $1,326 | $106,451 | $31,310 | $75,141 |
| 2021 | $1,350 | $104,364 | $30,696 | $73,668 |
| 2020 | $1,330 | $103,294 | $30,381 | $72,913 |
| 2019 | $1,294 | $101,268 | $29,785 | $71,483 |
| 2018 | $1,262 | $99,282 | $29,201 | $70,081 |
| 2017 | $1,252 | $97,335 | $28,628 | $68,707 |
| 2016 | $1,238 | $95,427 | $28,067 | $67,360 |
| 2015 | $1,229 | $93,993 | $27,645 | $66,348 |
| 2014 | $1,208 | $92,151 | $27,103 | $65,048 |
Source: Public Records
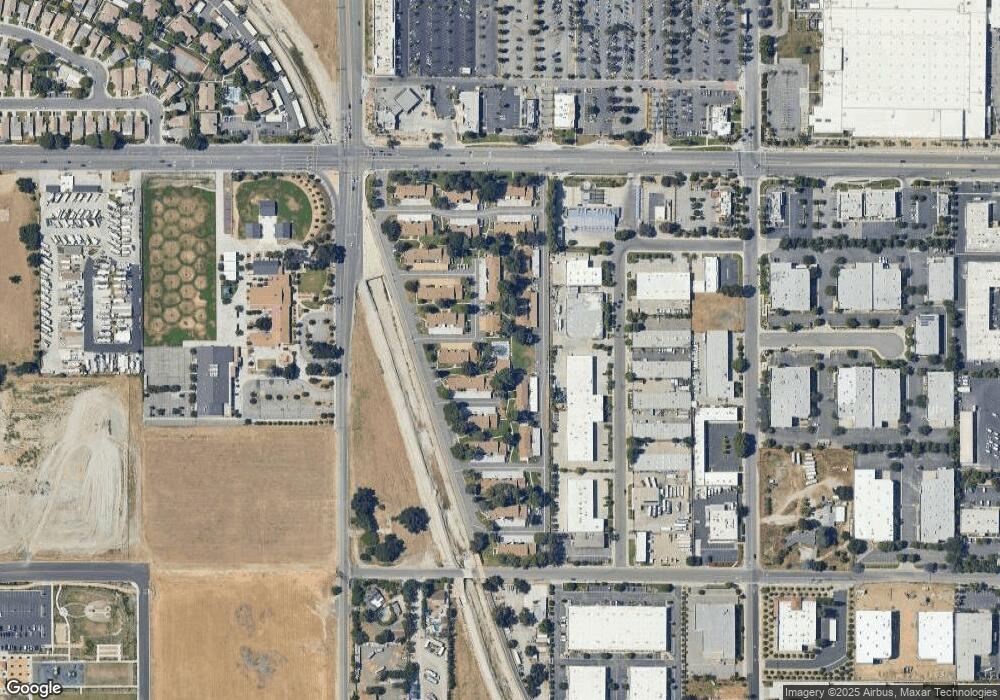
Map
Nearby Homes
- 26418 Citrus Ave
- 575 New Jersey St
- 26180 San Luis St
- 26162 San Luis St
- 26200 Redlands Blvd Unit 132
- 26200 Redlands Blvd Unit 96
- 26200 Redlands Blvd Unit 68
- 26200 Redlands Blvd Unit 148
- 26200 Redlands Blvd
- 10802 Mercury Dr
- 10800 Mercury Dr
- 10818 Mercury Dr
- 26623 Fino Ct
- 10812 Mercury Dr
- 10838 Mercury Dr
- 26416 Orange Ave
- 11098 Westin St
- 10972 Harris Dr
- 25860 Chula Vista St
- 25893 Amapolas St
- 2061 W Redlands Blvd
- 2061 W Redlands Blvd Unit C-5
- 2061 W Redlands Blvd Unit B8
- 2061 W Redlands Blvd Unit 22E
- 2061 W Redlands Blvd
- 2061 W Redlands Blvd Unit 14E
- 2061 W Redlands Blvd Unit 13E
- 2061 W Redlands Blvd Unit 13D
- 2061 W Redlands Blvd Unit 13C
- 2061 W Redlands Blvd Unit 13B
- 2061 W Redlands Blvd Unit 13A
- 2061 W Redlands Blvd Unit 12A
- 2061 W Redlands Blvd Unit 12B
- 2061 W Redlands Blvd Unit 12C
- 2061 W Redlands Blvd Unit 12D
- 2061 W Redlands Blvd Unit 12F
- 2061 W Redlands Blvd Unit 11F
- 2061 W Redlands Blvd Unit 11E
- 2061 W Redlands Blvd Unit 11D
- 2061 W Redlands Blvd Unit 11C
Your Personal Tour Guide
Ask me questions while you tour the home.