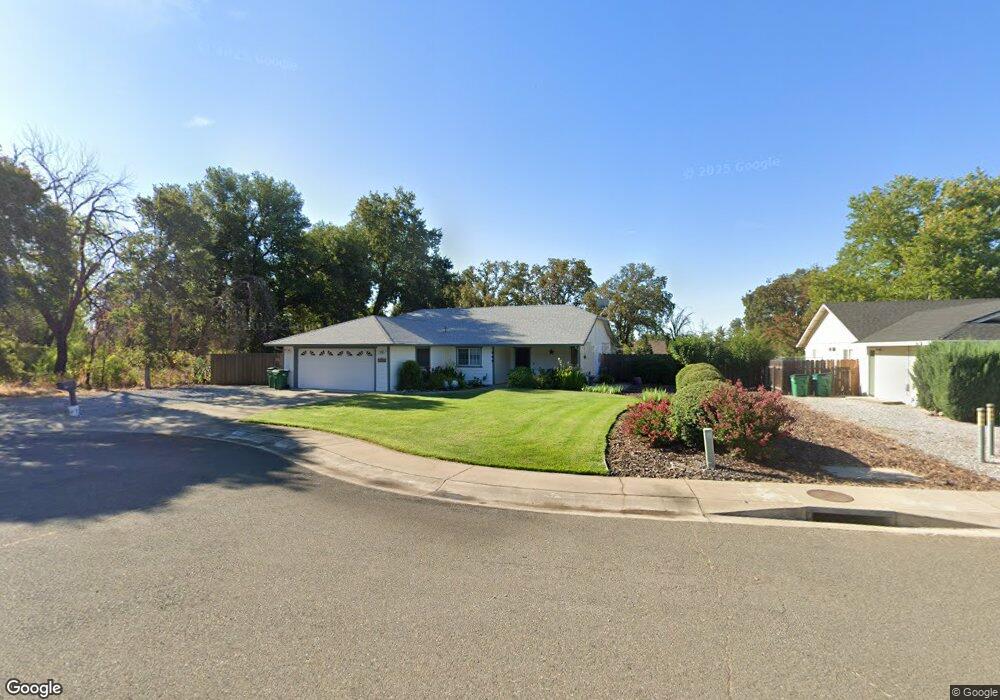
20629 Mayfair Ct Cottonwood, CA 96022
Estimated Value: $351,000 - $409,000
3
Beds
2
Baths
1,634
Sq Ft
$236/Sq Ft
Est. Value
About This Home
This home is located at 20629 Mayfair Ct, Cottonwood, CA 96022 and is currently estimated at $385,730, approximately $236 per square foot. 20629 Mayfair Ct is a home located in Shasta County with nearby schools including North Cottonwood, West Cottonwood Junior High School, and Cottonwood Creek Charter School.
Ownership History
Date
Name
Owned For
Owner Type
Purchase Details
Closed on
Jan 24, 2013
Sold by
Montgomery David Kay and Montgomery Joanne Kathryn
Bought by
Montgomery David Kay and Montgomery Joanne Kathryn
Current Estimated Value
Purchase Details
Closed on
Oct 21, 2011
Sold by
Montgomery David Kay and Montgomery Joanne Kathryn
Bought by
Montgomery David Kay and Montgomery Joanne Kathryn
Purchase Details
Closed on
Jan 12, 2006
Sold by
Montgomery Joanne Kathryn and Montgomery David Kay
Bought by
Montgomery David Kay and Montgomery Joanne Kathryn
Purchase Details
Closed on
Apr 9, 1999
Sold by
Kyle Ludwina M
Bought by
Montgomery David K and Montgomery Joanne K
Home Financials for this Owner
Home Financials are based on the most recent Mortgage that was taken out on this home.
Original Mortgage
$75,000
Outstanding Balance
$18,991
Interest Rate
7.04%
Estimated Equity
$366,739
Purchase Details
Closed on
Aug 19, 1998
Sold by
Mayfair Homes
Bought by
Kyle Ludwina M
Home Financials for this Owner
Home Financials are based on the most recent Mortgage that was taken out on this home.
Original Mortgage
$89,300
Interest Rate
6.91%
Create a Home Valuation Report for This Property
The Home Valuation Report is an in-depth analysis detailing your home's value as well as a comparison with similar homes in the area
Home Values in the Area
Average Home Value in this Area
Purchase History
| Date | Buyer | Sale Price | Title Company |
|---|---|---|---|
| Montgomery David Kay | -- | None Available | |
| Montgomery David Kay | -- | None Available | |
| Montgomery David Kay | -- | None Available | |
| Montgomery David K | $115,000 | Chicago Title Co | |
| Kyle Ludwina M | $112,000 | Placer Title Company |
Source: Public Records
Mortgage History
| Date | Status | Borrower | Loan Amount |
|---|---|---|---|
| Open | Montgomery David K | $75,000 | |
| Previous Owner | Kyle Ludwina M | $89,300 |
Source: Public Records
Tax History Compared to Growth
Tax History
| Year | Tax Paid | Tax Assessment Tax Assessment Total Assessment is a certain percentage of the fair market value that is determined by local assessors to be the total taxable value of land and additions on the property. | Land | Improvement |
|---|---|---|---|---|
| 2025 | $1,991 | $185,836 | $39,180 | $146,656 |
| 2024 | $1,950 | $182,193 | $38,412 | $143,781 |
| 2023 | $1,950 | $178,621 | $37,659 | $140,962 |
| 2022 | $1,906 | $175,120 | $36,921 | $138,199 |
| 2021 | $1,894 | $171,688 | $36,198 | $135,490 |
| 2020 | $1,848 | $169,928 | $35,827 | $134,101 |
| 2019 | $1,824 | $166,597 | $35,125 | $131,472 |
| 2018 | $1,789 | $163,332 | $34,437 | $128,895 |
| 2017 | $1,792 | $160,130 | $33,762 | $126,368 |
| 2016 | $1,641 | $156,991 | $33,100 | $123,891 |
| 2015 | $1,648 | $154,634 | $32,603 | $122,031 |
| 2014 | $1,608 | $151,606 | $31,965 | $119,641 |
Source: Public Records
Map
Nearby Homes
- Lot 4 Rhonda Rd
- 3796 Country Estates Dr
- 20605 Beta Ct
- 20472 Robinson Glen Dr
- 3850 Main St Unit 4
- 3850 Main St Unit 23
- 3850 Main St Unit 17
- 3850 Main St Unit 22
- 0 Main St Unit 25-870
- 0 Main St Unit 25-715
- 20720 2nd St
- 20882 3rd St
- 16857 Gas Point Rd
- Lot 13 Castlewood Ln
- 3382 Willow St
- 3349 Willow St
- 20933 Foster St
- 20960 1st St
- 20280 Trefoil Ln
- 3393 Shirley St
- 20625 Mayfair Ct
- 20630 Mayfair Ct
- 3679 Rhonda Rd
- 3651 Rhonda Rd
- 20636 Mayfair Ct
- 20610 Mayfair 1weup7mr20t3
- 20610 Mayfair Ct
- 20630 Collin Ct
- 20650 Collin Ct
- 20640 Collin Ct
- 3663 Rhonda Rd
- 20620 Collin Ct
- 20655 Aiden Ct
- 20645 Aiden Ct
- 20610 Collin Ct
- 20670 Collin Ct
- 20635 Aiden Ct
- 20625 Aiden Ct
- 20605 Aiden Ct Unit Lot 1
- 20605 Aiden Ct