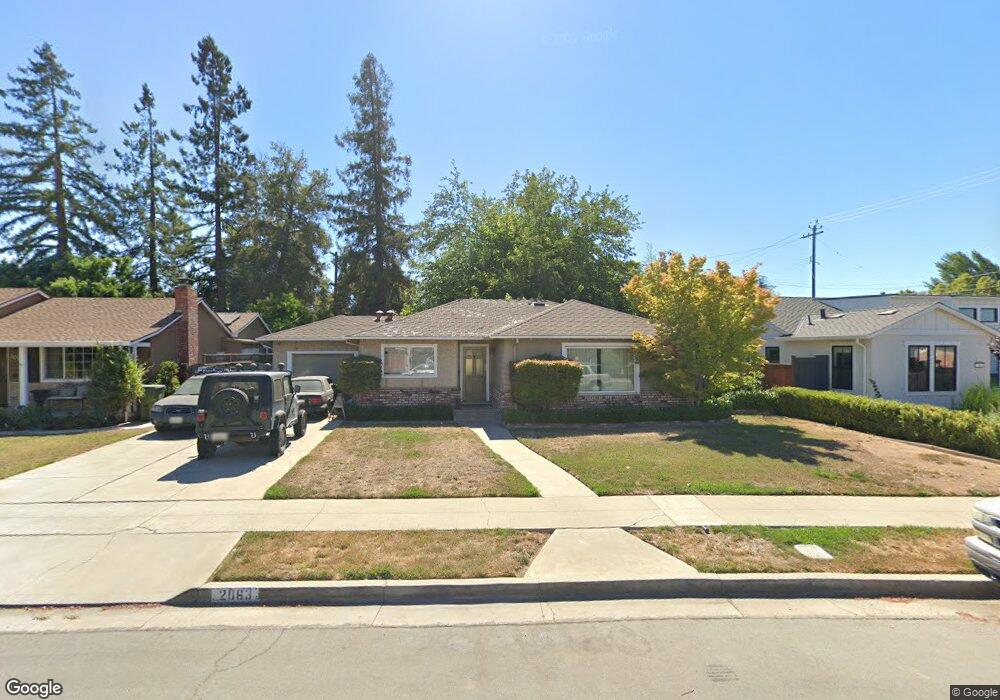
2063 Harmil Way San Jose, CA 95125
Willow Glen NeighborhoodEstimated Value: $1,693,221 - $1,974,000
3
Beds
2
Baths
1,421
Sq Ft
$1,326/Sq Ft
Est. Value
About This Home
This home is located at 2063 Harmil Way, San Jose, CA 95125 and is currently estimated at $1,884,555, approximately $1,326 per square foot. 2063 Harmil Way is a home located in Santa Clara County with nearby schools including Booksin Elementary, Willow Glen Middle, and Willow Glen High School.
Ownership History
Date
Name
Owned For
Owner Type
Purchase Details
Closed on
May 25, 2006
Sold by
Paradiso Susan M
Bought by
Paradiso Susan M
Current Estimated Value
Purchase Details
Closed on
Mar 7, 2005
Sold by
Paradiso John
Bought by
Paradiso John and Paradiso Susan M
Home Financials for this Owner
Home Financials are based on the most recent Mortgage that was taken out on this home.
Original Mortgage
$200,000
Outstanding Balance
$101,663
Interest Rate
5.65%
Mortgage Type
New Conventional
Estimated Equity
$1,782,892
Purchase Details
Closed on
Feb 10, 2005
Sold by
Arioto Barbara
Bought by
Paradiso John
Home Financials for this Owner
Home Financials are based on the most recent Mortgage that was taken out on this home.
Original Mortgage
$200,000
Outstanding Balance
$101,663
Interest Rate
5.65%
Mortgage Type
New Conventional
Estimated Equity
$1,782,892
Purchase Details
Closed on
Sep 26, 1994
Sold by
Paradiso Joseph and Paradiso Thelma
Bought by
Paradiso Joseph and Paradiso Thelma
Create a Home Valuation Report for This Property
The Home Valuation Report is an in-depth analysis detailing your home's value as well as a comparison with similar homes in the area
Home Values in the Area
Average Home Value in this Area
Purchase History
| Date | Buyer | Sale Price | Title Company |
|---|---|---|---|
| Paradiso Susan M | -- | None Available | |
| Paradiso John | -- | Alliance Title Company | |
| Paradiso John | -- | -- | |
| Paradiso Joseph | -- | -- |
Source: Public Records
Mortgage History
| Date | Status | Borrower | Loan Amount |
|---|---|---|---|
| Open | Paradiso John | $200,000 |
Source: Public Records
Tax History Compared to Growth
Tax History
| Year | Tax Paid | Tax Assessment Tax Assessment Total Assessment is a certain percentage of the fair market value that is determined by local assessors to be the total taxable value of land and additions on the property. | Land | Improvement |
|---|---|---|---|---|
| 2025 | $2,520 | $82,416 | $26,537 | $55,879 |
| 2024 | $2,520 | $80,801 | $26,017 | $54,784 |
| 2023 | $2,427 | $79,217 | $25,507 | $53,710 |
| 2022 | $2,393 | $77,664 | $25,007 | $52,657 |
| 2021 | $2,280 | $76,142 | $24,517 | $51,625 |
| 2020 | $2,179 | $75,362 | $24,266 | $51,096 |
| 2019 | $2,103 | $73,886 | $23,791 | $50,095 |
| 2018 | $2,055 | $72,438 | $23,325 | $49,113 |
| 2017 | $2,021 | $71,018 | $22,868 | $48,150 |
| 2016 | $1,887 | $69,626 | $22,420 | $47,206 |
| 2015 | $2,742 | $68,581 | $22,084 | $46,497 |
| 2014 | $1,387 | $67,239 | $21,652 | $45,587 |
Source: Public Records
Map
Nearby Homes
- 2059 Jonathan Ave
- 1920 Glen Una Ave
- 1037 Hazelwood Ave
- 1105 Lincoln Ct
- 1109 Lincoln Ct
- 2114 Ardis Dr
- 1768 Harmil Way
- 1110 Norval Way
- 1028 Pascoe Ave
- 1719 Glen Una Ave
- 2206 Almaden Rd Unit B
- 1027 Shenandoah Dr
- 2070 Almaden Rd
- 2296 Almaden Rd Unit B
- 888 Pine Ave
- 2150 Almaden Rd Unit 147
- 2150 Almaden Rd
- 2150 Almaden Rd Unit 103
- 1176 Laurie Ave
- 1124 Pine Ave
- 2071 Harmil Way
- 2051 Harmil Way
- 1000 Malone Rd
- 1002 Malone Rd
- 2083 Harmil Way
- 1006 Malone Rd
- 2062 Harmil Way
- 2068 Harmil Way
- 939 Terra Bella Ave
- 2039 Harmil Way
- 968 Malone Rd
- 2076 Harmil Way
- 2091 Harmil Way
- 2048 Glen Una Ave
- 1010 Malone Rd
- 941 Terra Bella Ave
- 2084 Harmil Way
- 965 Malone Rd
- 2033 Harmil Way
- 943 Terra Bella Ave