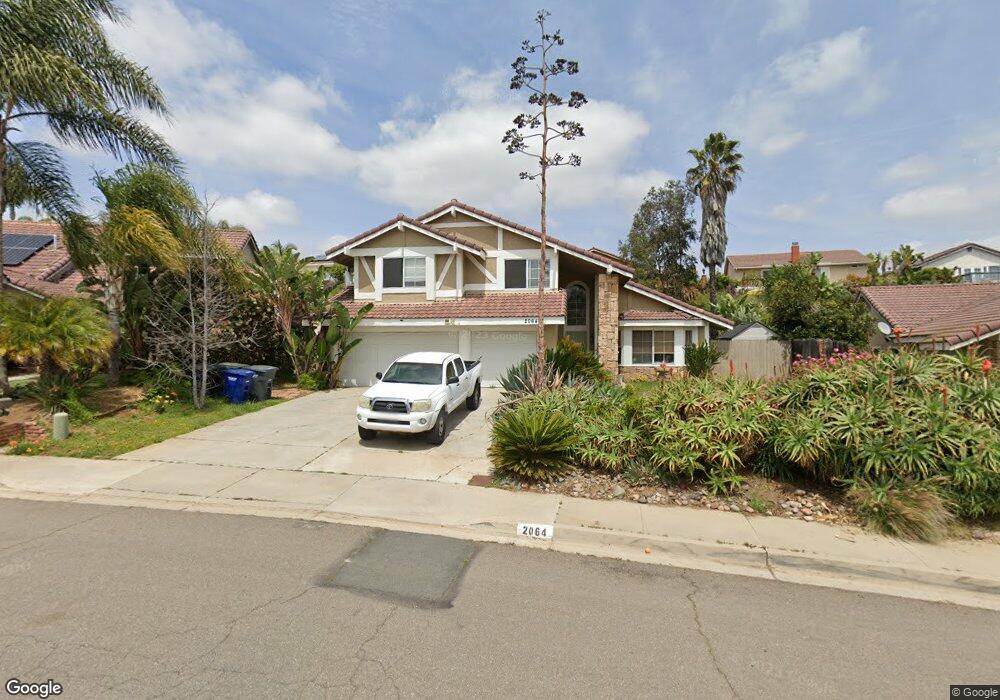
2064 Teton Pass St El Cajon, CA 92019
Rancho Park NeighborhoodEstimated Value: $1,114,000 - $1,177,000
3
Beds
3
Baths
2,248
Sq Ft
$511/Sq Ft
Est. Value
About This Home
This home is located at 2064 Teton Pass St, El Cajon, CA 92019 and is currently estimated at $1,147,652, approximately $510 per square foot. 2064 Teton Pass St is a home located in San Diego County with nearby schools including Vista Grande Elementary, Hillsdale Middle School, and Valhalla High.
Ownership History
Date
Name
Owned For
Owner Type
Purchase Details
Closed on
Aug 5, 2005
Sold by
Johnson Beverly
Bought by
Johnson Marc Steven and Johnson Beverly A
Current Estimated Value
Home Financials for this Owner
Home Financials are based on the most recent Mortgage that was taken out on this home.
Original Mortgage
$378,000
Outstanding Balance
$213,131
Interest Rate
6.82%
Mortgage Type
Unknown
Estimated Equity
$934,521
Purchase Details
Closed on
Jan 10, 2003
Sold by
Johnson Marc S
Bought by
Johnson Beverly
Home Financials for this Owner
Home Financials are based on the most recent Mortgage that was taken out on this home.
Original Mortgage
$345,000
Interest Rate
5.96%
Purchase Details
Closed on
Mar 6, 2001
Sold by
Heyer Thomas A and Heyer Pamela A
Bought by
Johnson Marc S and Johnson Beverly A
Home Financials for this Owner
Home Financials are based on the most recent Mortgage that was taken out on this home.
Original Mortgage
$255,500
Interest Rate
8.25%
Purchase Details
Closed on
Nov 8, 1985
Create a Home Valuation Report for This Property
The Home Valuation Report is an in-depth analysis detailing your home's value as well as a comparison with similar homes in the area
Home Values in the Area
Average Home Value in this Area
Purchase History
| Date | Buyer | Sale Price | Title Company |
|---|---|---|---|
| Johnson Marc Steven | -- | Fidelity National Title Co | |
| Johnson Beverly | -- | Southland Title | |
| Johnson Marc S | $373,500 | Fidelity National Title | |
| -- | $127,500 | -- |
Source: Public Records
Mortgage History
| Date | Status | Borrower | Loan Amount |
|---|---|---|---|
| Open | Johnson Marc Steven | $378,000 | |
| Closed | Johnson Beverly | $345,000 | |
| Previous Owner | Johnson Marc S | $255,500 |
Source: Public Records
Tax History Compared to Growth
Tax History
| Year | Tax Paid | Tax Assessment Tax Assessment Total Assessment is a certain percentage of the fair market value that is determined by local assessors to be the total taxable value of land and additions on the property. | Land | Improvement |
|---|---|---|---|---|
| 2025 | $6,520 | $539,190 | $184,651 | $354,539 |
| 2024 | $6,520 | $528,619 | $181,031 | $347,588 |
| 2023 | $6,350 | $518,255 | $177,482 | $340,773 |
| 2022 | $6,245 | $508,094 | $174,002 | $334,092 |
| 2021 | $6,159 | $498,133 | $170,591 | $327,542 |
| 2020 | $6,052 | $493,026 | $168,842 | $324,184 |
| 2019 | $5,978 | $483,360 | $165,532 | $317,828 |
| 2018 | $5,881 | $473,884 | $162,287 | $311,597 |
| 2017 | $5,805 | $464,593 | $159,105 | $305,488 |
| 2016 | $5,578 | $455,485 | $155,986 | $299,499 |
| 2015 | $5,541 | $448,644 | $153,643 | $295,001 |
| 2014 | $5,434 | $439,857 | $150,634 | $289,223 |
Source: Public Records
Map
Nearby Homes
- 1781 Colter Lake Ct
- 2643 Wind River Rd
- 2552 Wind River Rd
- 1828 Donahue Dr
- 1819 Monarch Ridge Cir
- 1726 Valkyria Ln
- 2846 Willow Glen Dr
- 2030 Seca St
- 1810 Hillsdale Rd Unit 18
- 1810 Hillsdale Rd Unit 57
- 1803 Hillsdale Ln
- 1810 Jalisco Rd
- 0 Hillsdale Rd Unit PTP2503874
- 12093 Calle de Medio Unit 131
- 2333 Willow Glen Dr
- 2377 Congressional Dr
- 12038 Calle de Leon
- 12045 Calle de Medio Unit 104
- 12020 Calle de Medio Unit 174
- 2458 Sawgrass St
- 2070 Teton Pass St
- 2058 Teton Pass St
- 2039 Monaco Ct
- 2035 Monaco Ct
- 2045 Monaco Ct
- 2076 Teton Pass St
- 2050 Teton Pass St
- 2029 Monaco Ct
- 2049 Monaco Ct
- 2053 Teton Pass St
- 2034 Donahue Dr
- 2021 Monaco Ct
- 2051 Monaco Ct
- 2044 Teton Pass St
- 2084 Teton Pass St
- 2015 Monaco Ct
- 2043 Teton Pass St
- 2055 Monaco Ct
- 2026 Donahue Dr
- 2032 Monaco Ct