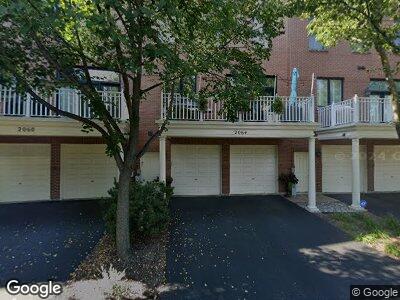
2064 Valor Ct Unit 17 Glenview, IL 60026
The Glen NeighborhoodEstimated Value: $786,525 - $966,000
4
Beds
5
Baths
3,400
Sq Ft
$259/Sq Ft
Est. Value
About This Home
This home is located at 2064 Valor Ct Unit 17, Glenview, IL 60026 and is currently estimated at $880,131, approximately $258 per square foot. 2064 Valor Ct Unit 17 is a home located in Cook County with nearby schools including Westbrook Elementary School, Glen Grove Elementary School, and Attea Middle School.
Ownership History
Date
Name
Owned For
Owner Type
Purchase Details
Closed on
May 19, 2011
Sold by
Kreske Jay F and Kreske Jennifer A
Bought by
Fenton Leslie D
Current Estimated Value
Home Financials for this Owner
Home Financials are based on the most recent Mortgage that was taken out on this home.
Original Mortgage
$200,000
Interest Rate
6%
Mortgage Type
Purchase Money Mortgage
Purchase Details
Closed on
Sep 30, 2003
Sold by
The Glen Townhomes Lp
Bought by
Kreske Jay F and Kreske Jennifer A
Home Financials for this Owner
Home Financials are based on the most recent Mortgage that was taken out on this home.
Original Mortgage
$114,518
Interest Rate
6.49%
Mortgage Type
Stand Alone Second
Create a Home Valuation Report for This Property
The Home Valuation Report is an in-depth analysis detailing your home's value as well as a comparison with similar homes in the area
Home Values in the Area
Average Home Value in this Area
Purchase History
| Date | Buyer | Sale Price | Title Company |
|---|---|---|---|
| Fenton Leslie D | $555,000 | Fntic | |
| Kreske Jay F | $762,500 | Stewart Title |
Source: Public Records
Mortgage History
| Date | Status | Borrower | Loan Amount |
|---|---|---|---|
| Open | Fenton Leslie D | $249,000 | |
| Closed | Fenton Leslle D | $185,500 | |
| Closed | Fenton Leslie D | $250,000 | |
| Closed | Fenton Leslie D | $200,000 | |
| Closed | Fenton Leslie D | $216,300 | |
| Closed | Fenton Leslie D | $200,000 | |
| Previous Owner | Kreske Jay F | $288,000 | |
| Previous Owner | Kreske Jay F | $114,518 | |
| Previous Owner | Kreske Jay F | $610,762 |
Source: Public Records
Tax History Compared to Growth
Tax History
| Year | Tax Paid | Tax Assessment Tax Assessment Total Assessment is a certain percentage of the fair market value that is determined by local assessors to be the total taxable value of land and additions on the property. | Land | Improvement |
|---|---|---|---|---|
| 2024 | $13,577 | $66,540 | $7,658 | $58,882 |
| 2023 | $13,577 | $66,540 | $7,658 | $58,882 |
| 2022 | $13,577 | $66,540 | $7,658 | $58,882 |
| 2021 | $14,319 | $60,861 | $3,675 | $57,186 |
| 2020 | $14,205 | $60,861 | $3,675 | $57,186 |
| 2019 | $13,237 | $66,891 | $3,675 | $63,216 |
| 2018 | $12,713 | $58,711 | $3,216 | $55,495 |
| 2017 | $12,388 | $58,711 | $3,216 | $55,495 |
| 2016 | $12,419 | $58,711 | $3,216 | $55,495 |
| 2015 | $12,261 | $51,489 | $2,603 | $48,886 |
| 2014 | $12,037 | $51,489 | $2,603 | $48,886 |
| 2013 | $12,036 | $53,104 | $2,603 | $50,501 |
Source: Public Records
Map
Nearby Homes
- 1981 Dauntless Dr
- 1855 Admiral Ct Unit 97
- 1864 Admiral Ct Unit 134
- 2110 Saipan Dr
- 3111 Coral Ln
- 3103 Coral Ln
- 2750 Commons Dr Unit 412
- 2862 Commons Dr
- 2454 W Lake Ave
- 2306 Sundrop Dr
- 1613 Monterey Dr
- 1597 Monterey Dr
- 1608 Saratoga Ln
- 1619 Patriot Blvd
- 2362 Fielding Dr
- 2213 Strawberry Ln
- 1437 Kittyhawk Ln
- 177 Princeton Ln
- 187 Princeton Ln Unit 35RG18
- 3148 Bellwood Ln
- 2064 Valor Ct Unit 17
- 2060 Valor Ct Unit 16
- 2068 Valor Ct Unit 18
- 2056 Valor Ct Unit 15
- 2072 Valor Ct Unit 19
- 2076 Valor Ct Unit 20
- 2052 Valor Ct Unit 14
- 2044 Valor Ct Unit 12
- 2040 Valor Ct Unit 11
- 2093 Valor Ct Unit 21
- 2036 Valor Ct Unit 10
- 2089 Valor Ct Unit 22
- 2032 Valor Ct Unit 9
- 2032 Valor Ct Unit 2032
- 2008 Valor Ct Unit 3
- 2012 Valor Ct Unit 4
- 2085 Valor Ct Unit 23
- 2000 Valor Ct Unit 1
- 2016 Valor Ct Unit 5
- 2016 Valor Ct Unit 1