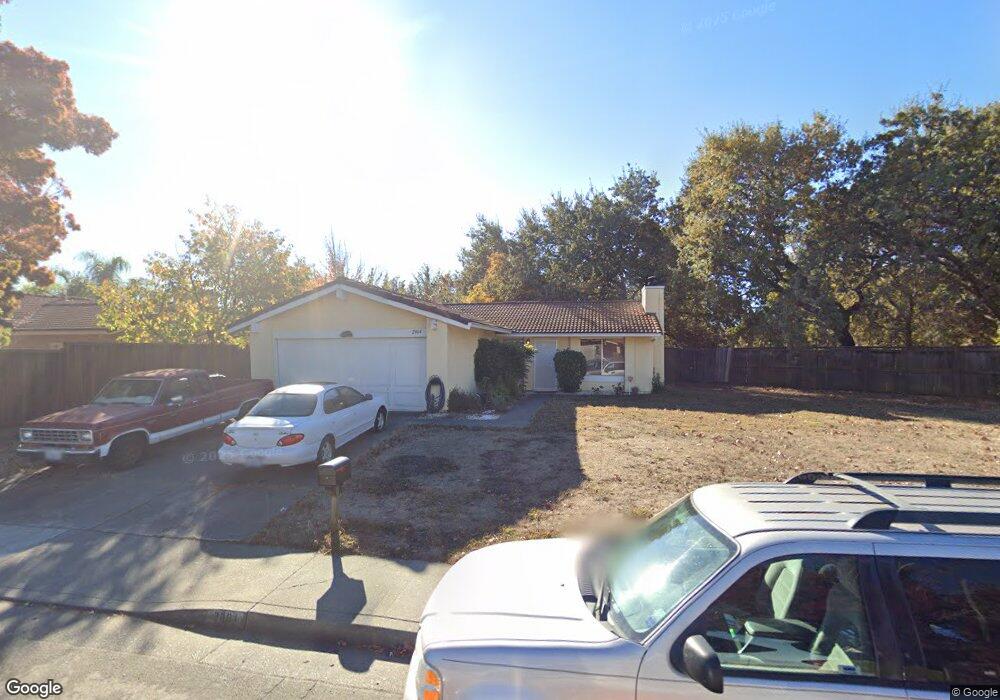
2064 Woolner Ave Fairfield, CA 94533
Estimated Value: $428,276 - $477,000
3
Beds
1
Bath
1,000
Sq Ft
$459/Sq Ft
Est. Value
About This Home
This home is located at 2064 Woolner Ave, Fairfield, CA 94533 and is currently estimated at $459,319, approximately $459 per square foot. 2064 Woolner Ave is a home located in Solano County with nearby schools including Crystal Middle School, Armijo High School, and We R Family Christian School.
Ownership History
Date
Name
Owned For
Owner Type
Purchase Details
Closed on
Mar 25, 2010
Sold by
Lim Michael William and Lim Rudolph Leslie June
Bought by
Lim Family Investments Llc
Current Estimated Value
Purchase Details
Closed on
Sep 28, 2000
Sold by
Lim Michael William and Lim Rudolph Leslie June
Bought by
Lim Michael William and Lim Rudolph Leslie June
Purchase Details
Closed on
Aug 19, 1993
Sold by
Lim William Ss
Bought by
Lim William S
Home Financials for this Owner
Home Financials are based on the most recent Mortgage that was taken out on this home.
Original Mortgage
$93,750
Interest Rate
6.75%
Purchase Details
Closed on
Aug 10, 1993
Sold by
Lim William S
Bought by
Lim William S
Home Financials for this Owner
Home Financials are based on the most recent Mortgage that was taken out on this home.
Original Mortgage
$93,750
Interest Rate
6.75%
Create a Home Valuation Report for This Property
The Home Valuation Report is an in-depth analysis detailing your home's value as well as a comparison with similar homes in the area
Home Values in the Area
Average Home Value in this Area
Purchase History
| Date | Buyer | Sale Price | Title Company |
|---|---|---|---|
| Lim Family Investments Llc | -- | None Available | |
| Lim Michael William | -- | -- | |
| Lim William S | -- | -- | |
| Lim William S | -- | Chicago Title Company |
Source: Public Records
Mortgage History
| Date | Status | Borrower | Loan Amount |
|---|---|---|---|
| Previous Owner | Lim William S | $93,750 |
Source: Public Records
Tax History
| Year | Tax Paid | Tax Assessment Tax Assessment Total Assessment is a certain percentage of the fair market value that is determined by local assessors to be the total taxable value of land and additions on the property. | Land | Improvement |
|---|---|---|---|---|
| 2025 | $2,374 | $210,949 | $62,153 | $148,796 |
| 2024 | $2,374 | $206,814 | $60,935 | $145,879 |
| 2023 | $2,302 | $202,760 | $59,741 | $143,019 |
| 2022 | $2,274 | $198,785 | $58,570 | $140,215 |
| 2021 | $2,252 | $194,888 | $57,422 | $137,466 |
| 2020 | $2,200 | $192,891 | $56,834 | $136,057 |
| 2019 | $2,146 | $189,110 | $55,720 | $133,390 |
| 2018 | $2,215 | $185,403 | $54,628 | $130,775 |
| 2017 | $2,113 | $181,768 | $53,557 | $128,211 |
| 2016 | $2,092 | $178,205 | $52,507 | $125,698 |
| 2015 | $1,953 | $175,529 | $51,719 | $123,810 |
| 2014 | $1,935 | $172,091 | $50,706 | $121,385 |
Source: Public Records
Map
Nearby Homes
- 324 Hamilton Dr
- 109 Creek View Cir
- 108 Creek View Cir
- 315 Hamilton Dr
- 309 Hamilton Dr
- 266 De Soto Dr
- 423 Gregory Ln Unit 28L
- 423 Gregory Ln Unit 30
- 1837 Vermont St
- 1949 New Jersey St
- 1443 Woolner Ave
- 3471 Springfield Dr
- 1654 Minnesota St
- 1625 Minnesota St
- 1417 Hawaii St
- 225 Pennsylvania Ave Unit E7
- 1042 Hayes St
- 1316 Empire St
- 1308 Empire St
- 1518 Astoria Dr
- 299 Woolner Ct
- 293 Woolner Ct
- 2063 Woolner Ave
- 2069 Woolner Ave
- 2057 Woolner Ave
- 2051 Woolner Ave
- 2075 Woolner Ave
- 2045 Woolner Ave
- 298 Woolner Ct
- 2218 Zinfandel Ct
- 2224 Zinfandel Ct
- 2212 Zinfandel Ct
- 2039 Woolner Ave
- 2206 Zinfandel Ct
- 286 Woolner Ct
- 2230 Zinfandel Ct
- 2088 Woolner Ave
- 280 Woolner Ct
- 2033 Woolner Ave
- 2200 Zinfandel Ct
Your Personal Tour Guide
Ask me questions while you tour the home.