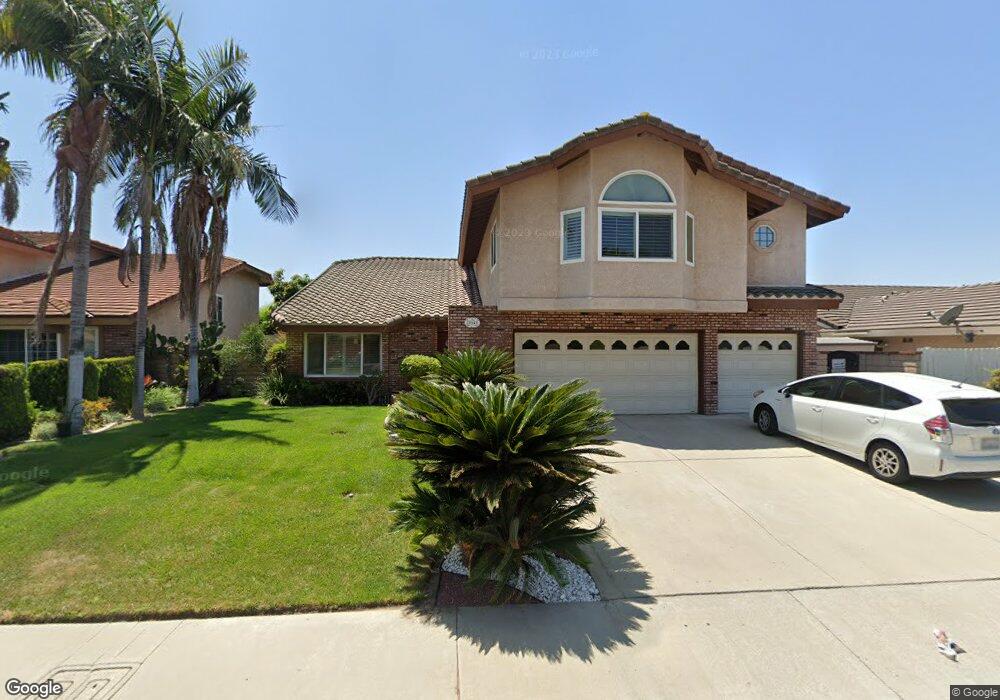
20640 Fuero Dr Walnut, CA 91789
Estimated Value: $1,386,050 - $1,871,000
5
Beds
4
Baths
3,097
Sq Ft
$521/Sq Ft
Est. Value
About This Home
This home is located at 20640 Fuero Dr, Walnut, CA 91789 and is currently estimated at $1,613,763, approximately $521 per square foot. 20640 Fuero Dr is a home located in Los Angeles County with nearby schools including Vejar Elementary School, Suzanne Middle School, and Walnut High School.
Ownership History
Date
Name
Owned For
Owner Type
Purchase Details
Closed on
May 5, 2020
Sold by
Phan Sean B and Phan Mylinh
Bought by
Phan Sean B and Phan Mylinh
Current Estimated Value
Home Financials for this Owner
Home Financials are based on the most recent Mortgage that was taken out on this home.
Original Mortgage
$466,000
Outstanding Balance
$366,753
Interest Rate
3.3%
Mortgage Type
New Conventional
Estimated Equity
$1,247,010
Purchase Details
Closed on
Dec 7, 2009
Sold by
Houng William W
Bought by
Yoshii Sean and Phan Mylinh
Home Financials for this Owner
Home Financials are based on the most recent Mortgage that was taken out on this home.
Original Mortgage
$560,000
Interest Rate
5.11%
Mortgage Type
New Conventional
Purchase Details
Closed on
Nov 6, 2000
Sold by
Gilbert Richard E
Bought by
Houng William W and Houng Cleo J
Home Financials for this Owner
Home Financials are based on the most recent Mortgage that was taken out on this home.
Original Mortgage
$250,000
Interest Rate
7.86%
Create a Home Valuation Report for This Property
The Home Valuation Report is an in-depth analysis detailing your home's value as well as a comparison with similar homes in the area
Home Values in the Area
Average Home Value in this Area
Purchase History
| Date | Buyer | Sale Price | Title Company |
|---|---|---|---|
| Phan Sean B | -- | Chicago Title | |
| Yoshii Sean | $725,000 | Ticor Title Company | |
| Houng William W | $370,000 | Orange Coast Title |
Source: Public Records
Mortgage History
| Date | Status | Borrower | Loan Amount |
|---|---|---|---|
| Open | Phan Sean B | $466,000 | |
| Previous Owner | Yoshii Sean | $560,000 | |
| Previous Owner | Houng William W | $250,000 |
Source: Public Records
Tax History
| Year | Tax Paid | Tax Assessment Tax Assessment Total Assessment is a certain percentage of the fair market value that is determined by local assessors to be the total taxable value of land and additions on the property. | Land | Improvement |
|---|---|---|---|---|
| 2025 | $11,450 | $935,835 | $326,055 | $609,780 |
| 2024 | $11,450 | $917,486 | $319,662 | $597,824 |
| 2023 | $11,175 | $899,497 | $313,395 | $586,102 |
| 2022 | $10,948 | $881,860 | $307,250 | $574,610 |
| 2021 | $10,743 | $864,570 | $301,226 | $563,344 |
| 2020 | $10,608 | $855,706 | $298,138 | $557,568 |
| 2019 | $10,407 | $838,929 | $292,293 | $546,636 |
| 2018 | $10,011 | $822,480 | $286,562 | $535,918 |
| 2016 | $9,275 | $790,544 | $275,436 | $515,108 |
| 2015 | $9,332 | $778,670 | $271,299 | $507,371 |
| 2014 | $9,339 | $763,418 | $265,985 | $497,433 |
Source: Public Records
Map
Nearby Homes
- 20824 Fuero Dr
- 21002 Cornerstone Dr
- 180 Ricci Ave
- 424 S Lemon Ave
- 19941 Ralph St
- 387 Bourdet St
- 792 El Vallencito Dr
- 455 Avenida Esplendor
- 3328 S Flemington Dr
- 451 Avenida Esplendor
- 21217 E Washington Unit 32
- 681 Castlehill Dr
- 685 Castlehill Dr
- 20491 Gartel Dr
- 693 Castlehill Dr
- 21203 Fibre Ct
- 779 Summerwood Ave
- 350 Foxboro Dr
- 513 Camino de Gloria
- 3300 E Millridge Dr
- 20650 Fuero Dr
- 20630 Fuero Dr
- 20660 Fuero Dr
- 20620 Fuero Dr
- 20645 Fuero Dr
- 20635 Fuero Dr
- 20655 Fuero Dr
- 120 Commerce Way
- 20670 Fuero Dr
- 20610 Fuero Dr
- 20665 E Fuero Dr
- 20665 Fuero Dr
- 20625 Fuero Dr
- 115 Commerce Way
- 20680 Fuero Dr
- 20615 Fuero Dr
- 20675 Fuero Dr
- 20600 Fuero Dr
- 182 Amberwood Dr
- 176 Amberwood Dr
Your Personal Tour Guide
Ask me questions while you tour the home.